Welcome, Future Space Leaders! 🚀
This guide is designed to help you master the core concepts of Geodesy, Remote Sensing, and GIS for Module 2. Review the key topics, watch the lecture videos, and test yourself with the practice scenarios below.
Good luck with your studies and the upcoming exam!
1. Geodesy & The "Lies" of Mapping
🎯 Learning Objectives
- I can explain why "all maps are lies" (generalization, classification, projection).
- I can describe the 3 Earth models (Sphere, Ellipsoid, Geoid).
- I can list the 4 map distortions.
The Three Layers of Location
To define a location on Earth, we need three stacked layers:
- Geodesy: Modeling the Earth's shape (Ellipsoid).
- Coordinate System: A grid for address (Lat/Long).
- Map Projection: Flattening the 3D grid to 2D.
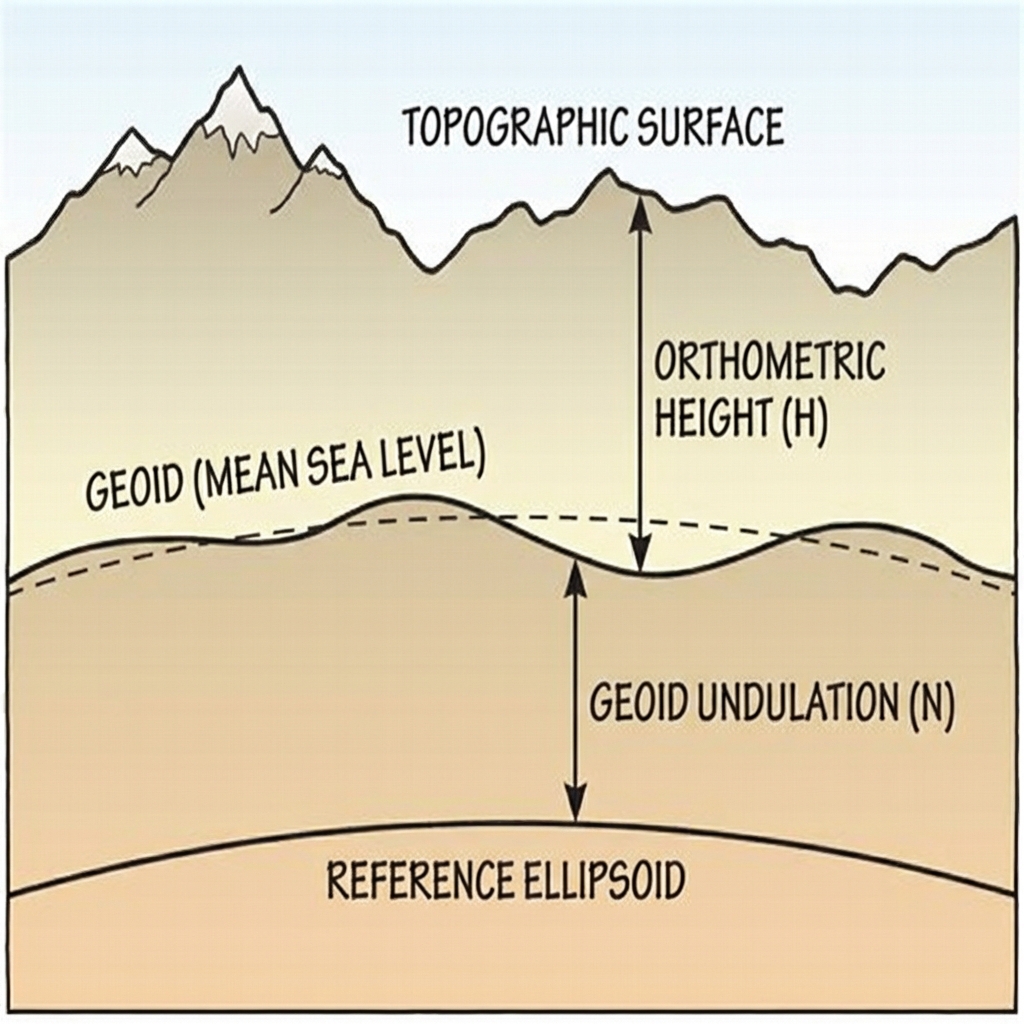
h = H + N
Ellipsoidal Height (h) = Orthometric Height (H) + Geoid Undulation (N)
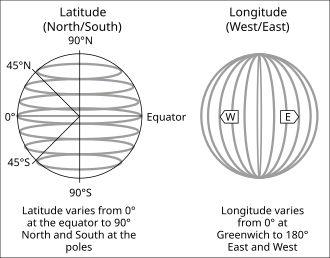
Coordinate Systems
Latitude (Phi): Measures angle North/South of the Equator. Lines are parallel "rungs on a ladder".
Longitude (Lambda): Measures angle East/West of the Prime Meridian. Lines converge at the poles (like orange slices).
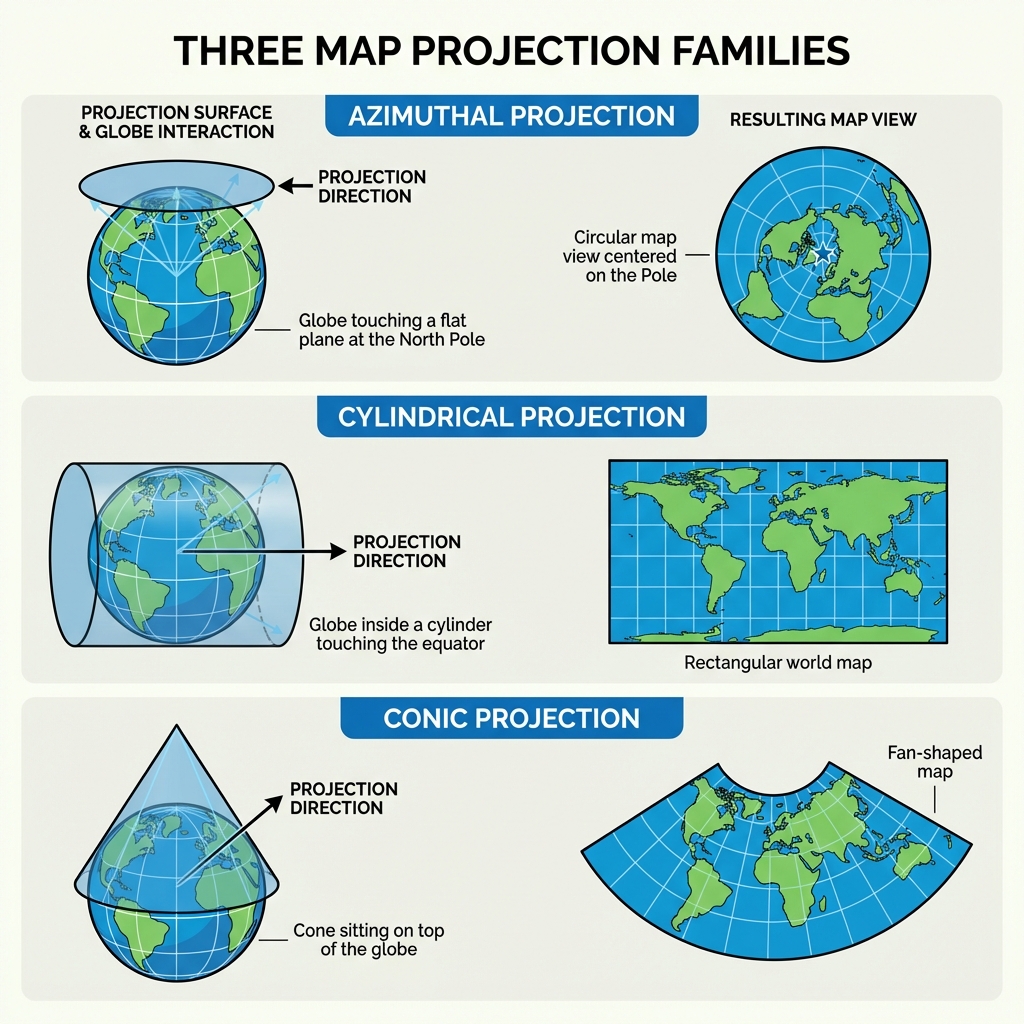
Map Projections & Distortions
It is impossible to flatten a round earth without distortion. Projections are classified by the surface they use:
- Cylindrical: Good for Equatorial regions (e.g., Mercator).
- Conic: Good for Mid-latitudes (e.g., Albers, LCC).
- Azimuthal (Planar): Good for Polar regions.
Classes of Map Projections
Projections are also defined by what they preserve:
| Property | Preserves... | Use Case | Example |
|---|---|---|---|
| Conformal | Angles & Shapes (Locally) | Navigation, Topographic Maps | Mercator, Lambert Conformal Conic |
| Equal Area (Equivalent) | Areas | Thematic Maps (Population density, Land cover) whereby comparing size is critical. | Albers Equal Area Conic |
| Equidistant | Distance (from a specific point) | Radio ranges, Air travel distances | Azimuthal Equidistant |
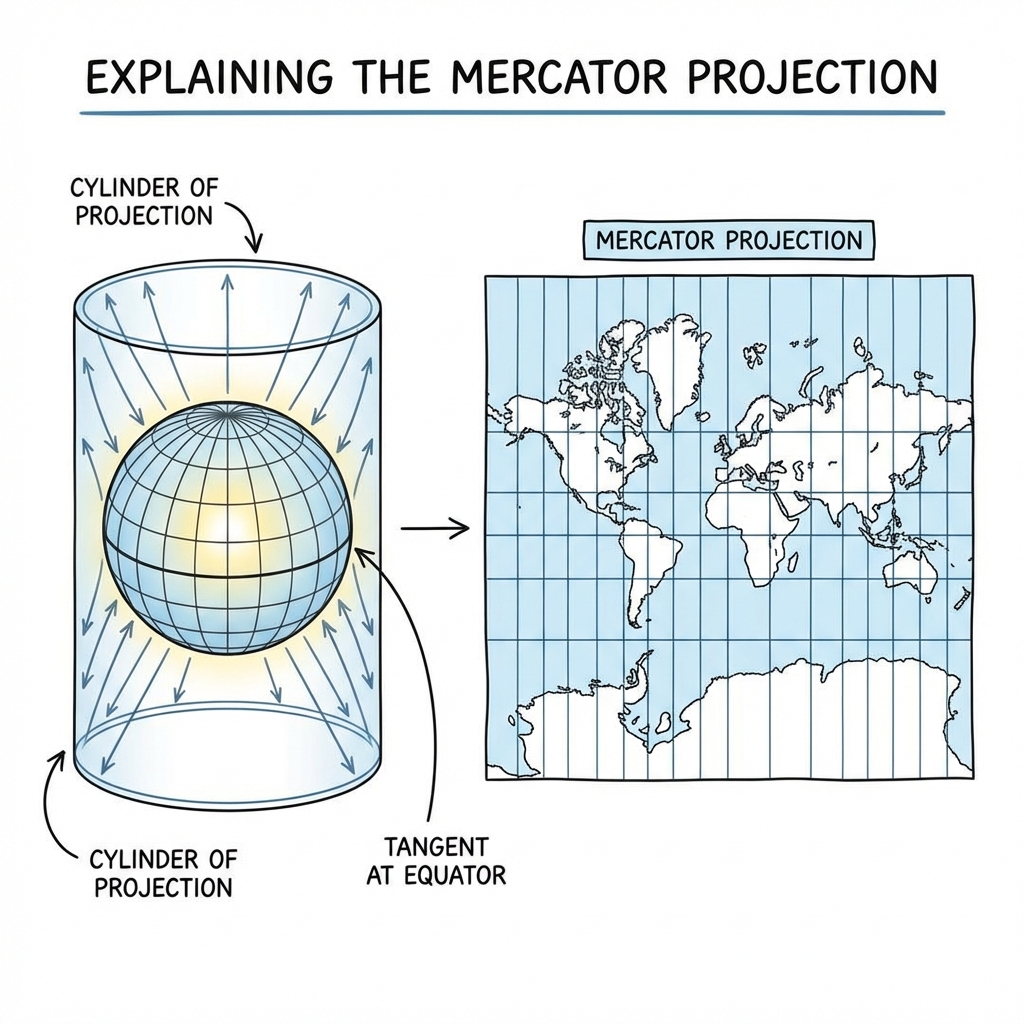
Spotlight: The Mercator Projection
The Mercator is a Cylindrical Conformal projection.
- Pro: Preserves direction. A straight line is a constant compass bearing (Rhumb Line). Essential for sailors.
- Con: Distorts area massively at the poles. Greenland looks as big as Africa (it's actually 14x smaller).
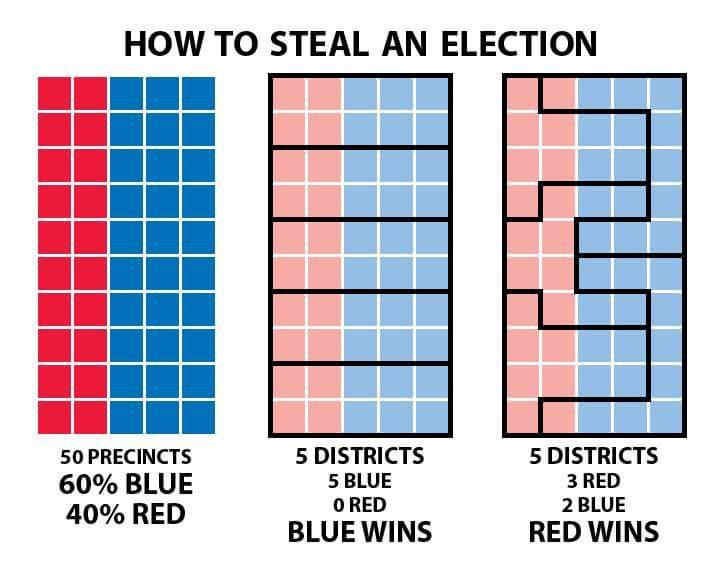
The Modifiable Areal Unit Problem (MAUP)
Map results can change dramatically based solely on how you draw the boundaries. This is the "Gerrymandering" of geography.
The Problem: The same underlying data can yield completely opposite results depending on aggregation zones.
- Scenario 1 (Blue Wins): Grouping into vertical rows makes Blue the majority in every district.
- Scenario 2 (Red Wins): "Creative" shape drawing (Gerrymandering) packs Blue into fewer districts, allowing Red to win the majority.
Limits of Representation: Eye, Mind, and Color
Effective mapping requires understanding the limitations of the user and the technology.
| Limit | Concept | Implication for Mapping |
|---|---|---|
| Eye Limit | Visual Acuity & Distinction The human eye has a limit to the detail (spatial resolution) and the number of colors it can distinguish. |
Don't display data at a higher resolution than the screen/eye can resolve. While 8-bit offers 16.7M colors, we can only distinguishing ~10M. |
| Mind's Limit | Cognitive Load (Miller's Law) The human brain can only hold about 7 (±2) items in working memory. |
Classification Rule: Never use more than 5-7 classes in a Choropleth map. Users cannot distinguish or remember 12 different shades of blue. |
| Color Limit | Bit Depth (0-255) Digital images are limited by their bit depth. |
Computers bin the infinite continuity of reality into discrete integers (0-255 for 8-bit). We lose slight variations to "quantization." ➜ Explore Color Brewer Tool |
2. Remote Sensing Fundamentals
🎯 Learning Objectives
- I can define the 4 Resolutions (Spatial, Spectral, Temporal, Radiometric).
- I can interpret a spectral signature graph.
- I can distinguish between Active and Passive sensors.
- I can explain how to create a False Color Composite.
The 4 Resolutions
| Resolution | Definition | Example |
|---|---|---|
| Spatial | Pixel size on ground | 30m (Landsat) vs 1m (Aerial) |
| Spectral | Number/width of bands | Multispectral (10 bands) vs Hyperspectral (200 bands) |
| Temporal | Revisit time | Daily (Weather) vs 16 days (Landsat) |
| Radiometric | Sensitivity (bit depth) | 8-bit (256 levels) vs 12-bit (4096 levels) |
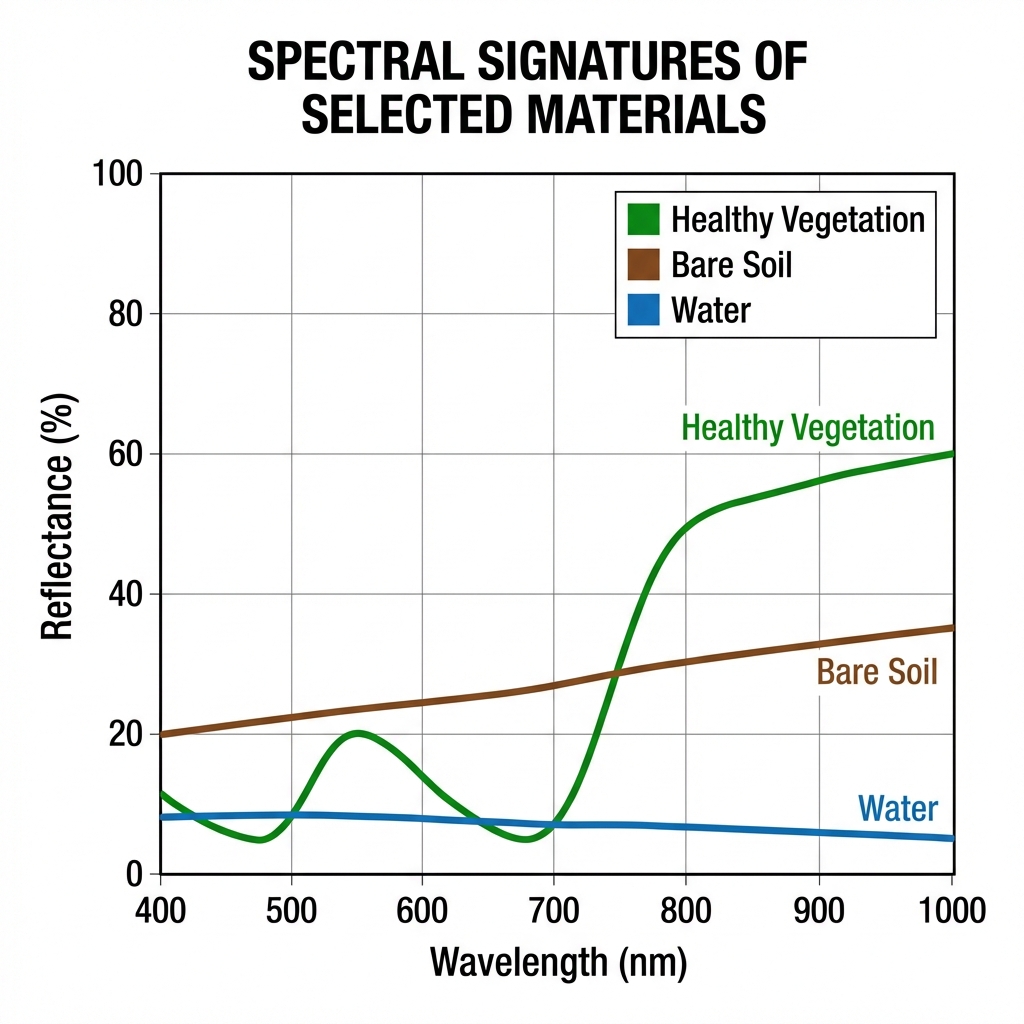
Spectral Signatures
Every material reflects light differently. This "signature" allows us to identify materials.
- Passive: Uses sun's energy (Photography, Landsat). No data at night.
- Active: Sends own energy pulse (LiDAR, Radar). Works day/night and through clouds (Radar).
3. Data Models & Analysis
🎯 Learning Objectives
- I can calculate and interpret NDVI.
- I can compare Raster vs. Vector data models.
- I can explain Supervised vs. Unsupervised Classification.
Raster vs. Vector
| Model | Best For... | Example |
|---|---|---|
| Raster | Continuous data | Elevation, Temperature, Satellite Imagery |
| Vector | Discrete data | Roads, Property Lines, Cities |
NDVI (Vegetation Index)
Uses the contrast between RED (absorbed by plants) and NIR (reflected by plants) to measure health.
Interpretation:
- > 0.5: Healthy Vegetation
- 0.1 - 0.2: Bare Soil
- < 0: Non-vegetated and Impervious Land Cover (Water, Concrete, Snow)
📐 Formula Sheet
DD = Degrees + (Minutes / 60) + (Seconds / 3600)
*Make negative for South or West!
NDVI = (NIR - Red) / (NIR + Red)
Circumference = Distance × (360° / Shadow Angle)
2⁸ = 256 levels (0-255) per channel
📺 Video Lecture Library
Review key concepts with these selected video lectures.
➜ Look at Weeks 1 and 2 on "Think" (RSGEE)
📝 Practice Questions
Test yourself! Click to reveal the answer.
1. A satellite image has a Spatial Resolution of 30 meters. What does this mean?
2. Calculate the NDVI for a pixel with Red=0.1 and NIR=0.5.
This indicates healthy vegetation.
3. Why do we divide by (NIR + Red) in the NDVI formula?
4. Name one advantage of LiDAR (Active) over standard Satellite Imagery (Passive).
5. You want to map specific tree species in a forest. Which type of resolution is most critical?
6. Convert 30° 30' 00" West to Decimal Degrees.
Total = 30.5.
Since it is WEST, it must be negative.
Answer: -30.50
7. Explain the evolution of Earth Models (Sphere -> Ellipsoid -> Geoid).
- Sphere: Simple, used for small scales (globes). Inaccurate for GPS.
- Ellipsoid (WGS 84): Flattens at poles due to rotation (Centrifugal Force). Used for GPS coordinates.
- Geoid: "Lumpy" model based on gravity/sea level. The most accurate representation of Earth's true shape.
8. Compare SRTM (30m) vs. LiDAR (1m) for flood mapping.
LiDAR (1m) captures micro-topography, allowing for precise modeling of water flow and flood risks in urban areas.
9. What are the trade-offs between Drone (SfM) and Satellite Imagery?
Satellite: Global coverage, consistent revisit times, but lower resolution and subject to cloud cover.
10. What is a Geodetic Datum (e.g., WGS 84)?
11. Explain the difference between Raster and Vector data.
Vector: Points, lines, and polygons (best for discrete objects like roads/property boundaries).
12. Why does the Mercator projection distort area at the poles?
13. You have an 8-bit image. What is the maximum pixel value?
14. What is the "Orange Peel Problem" in mapping?
15. True or False: A "Red State / Blue State" map is immune to the MAUP.
16. What does a "False Color Composite" (NIR, Red, Green) help visualize?
17. Why is "Temporal Resolution" important for disaster response?
18. In GIS logic, what does "Forest AND Elevation > 1000m" do?
19. Which coordinate system layer uses "Easting and Northing"?
🚀 Advanced Scenario Practice
20. Scenario: Mapping Air Quality. You have (A) Average pollution levels by city district (Discrete) and (B) Continuous sensor node data (Continuous). Which map type for each?
- (A) By District: Use a Choropleth Map. It colors defined areas (polygons) based on a value.
- (B) Continuous Data: Use an Isopleth Map (Heatmap/Contour). Air pollution drifts continuously across borders; it doesn't stop at a city line.
21. Scenario: Global Forest Map. Why is the Mercator projection a poor choice for comparing the size of the Amazon Rainforest (Equator) vs. the Siberian Taiga (High North)?
22. Calculate: Convert Sydney Opera House Coordinates (33° 51' 24" S, 151° 12' 36" E) to Decimal Degrees.
- Latitude (South is Negative): -(33 + 51/60 + 24/3600) = -(33 + 0.85 + 0.0067) = -33.8567
- Longitude (East is Positive): 151 + 12/60 + 36/3600 = 151 + 0.2 + 0.01 = 151.21
23. Scenario: The "Fake Grass" Detective. A soccer field looks bright green (RGB) but has a very low NDVI (0.05). Why?
24. Scenario: Oil Spill Tracking. You need to monitor a rapidly spreading oil spill. Which two resolutions are critical?
- Temporal Resolution: Critical. You need images *every few hours or days* to see where the oil is moving. A 16-day revisit time is useless here.
- Spectral Resolution: Important. You need specific bands (Thermal/IR) to distinguish oil from water.
25. Scenario: Spy vs. Weather Satellite. Satellite A visits the same spot at the same time every day. Satellite B hovers over one spot constantly. Name their orbits.
- Satellite A (Spy/Monitoring): Sun-Synchronous Orbit (Polar). Good for consistent lighting for comparisons.
- Satellite B (Weather/Comms): Geostationary Orbit. Matches Earth's rotation to "stare" at one hemisphere.