
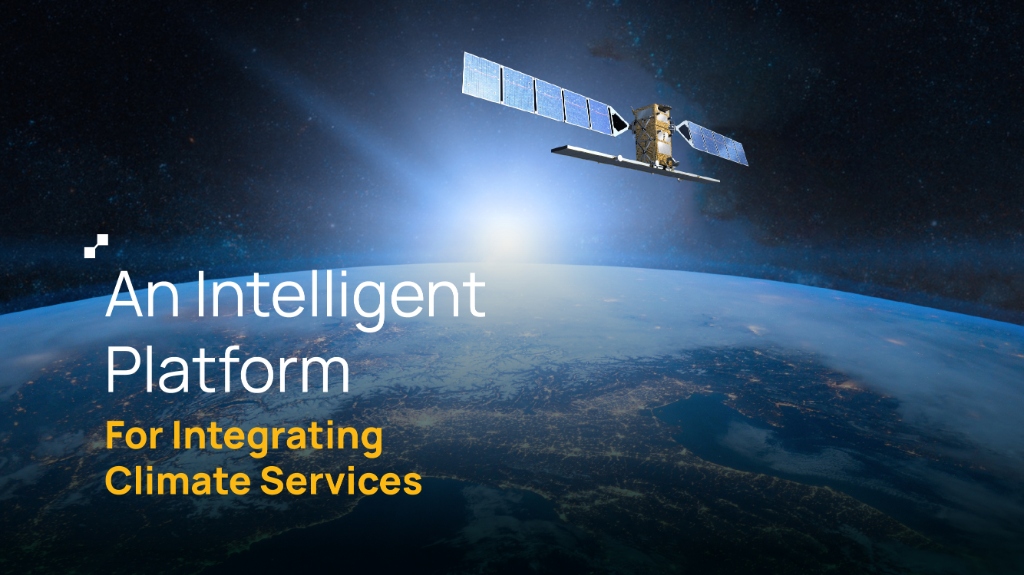
TERRA Live:
Intelligent Climate Services
from Space
A Silent Revolution
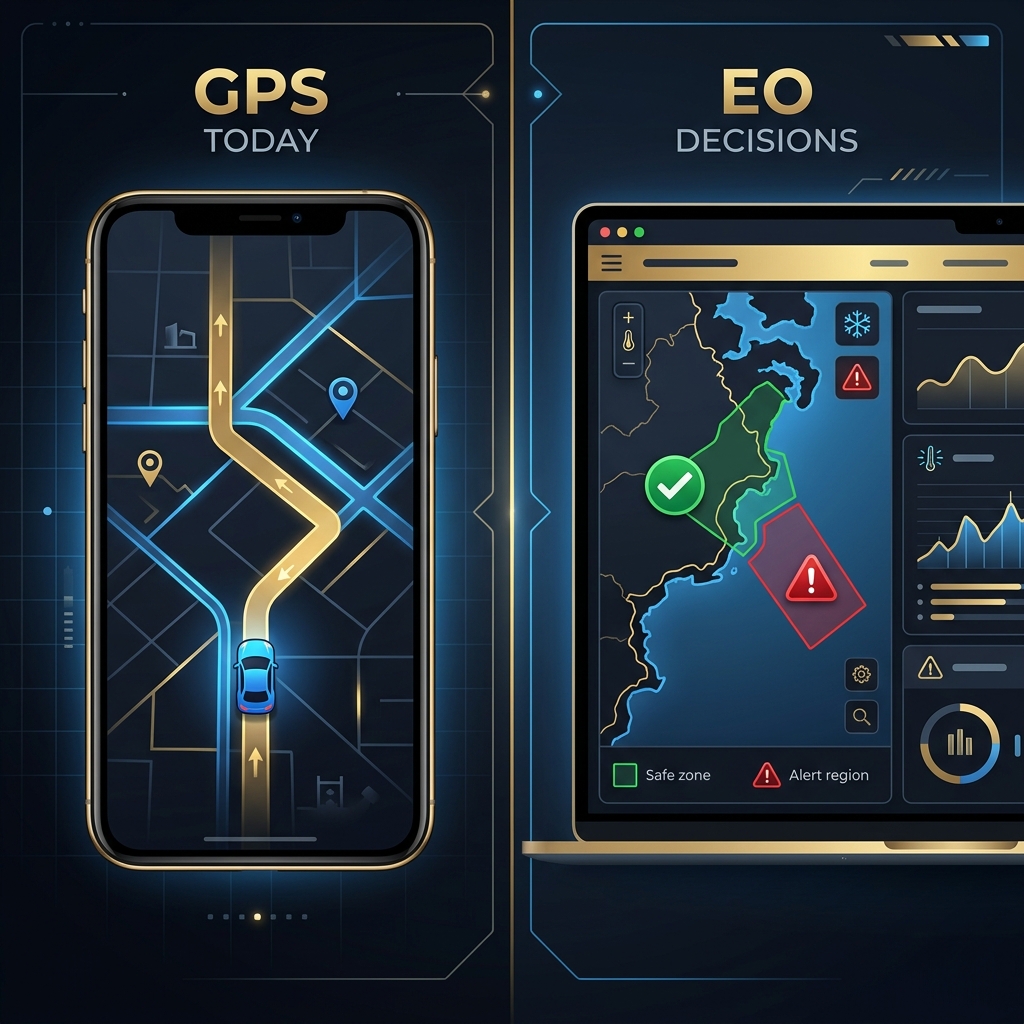
Who used GPS today?
Almost every hand in the room goes up. You used it for maps, weather, ridesharing, or routing a package. It is completely integrated into daily life.
Who used Earth Observation today?
Almost no hands go up. Yet, satellite data determined the flood risk of your building, assessed the health of the crops for your lunch, and routed the ship carrying your smartphone.
 🔍 Click to Zoom
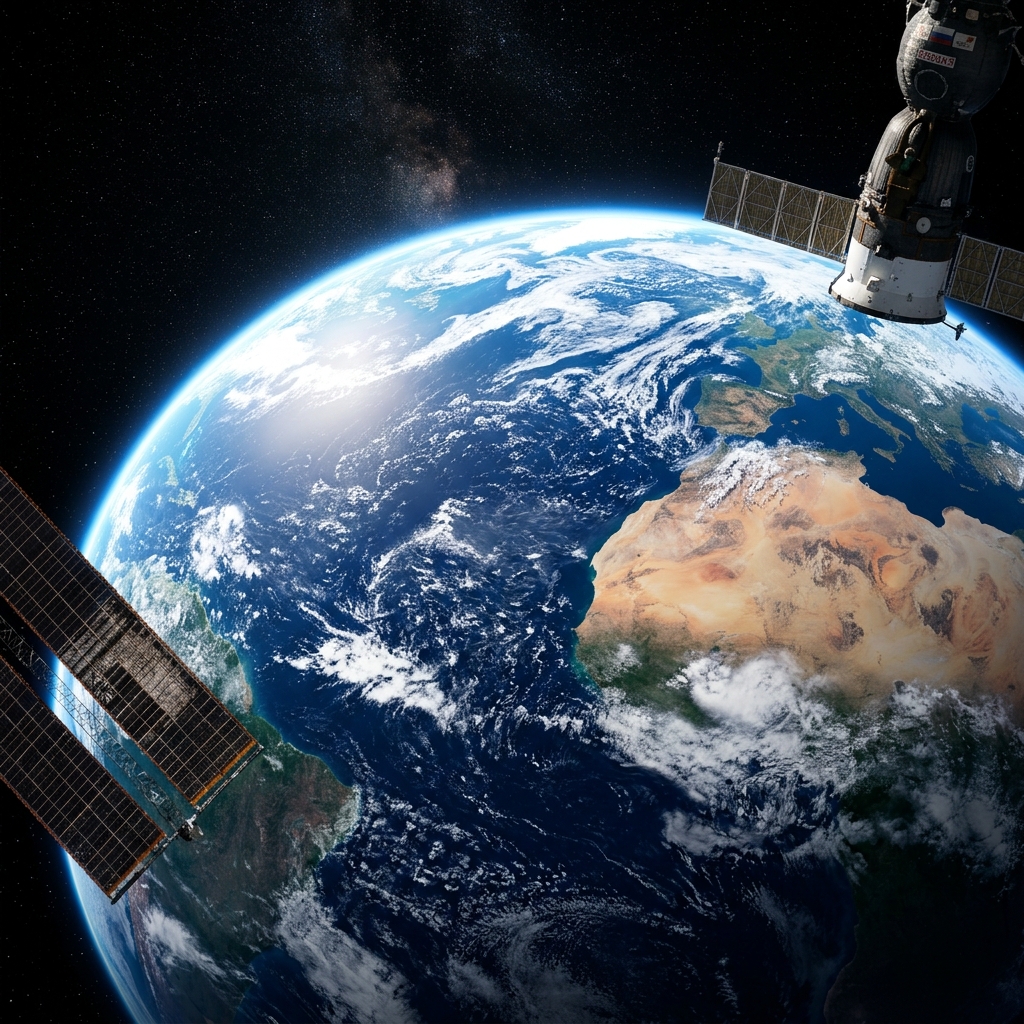
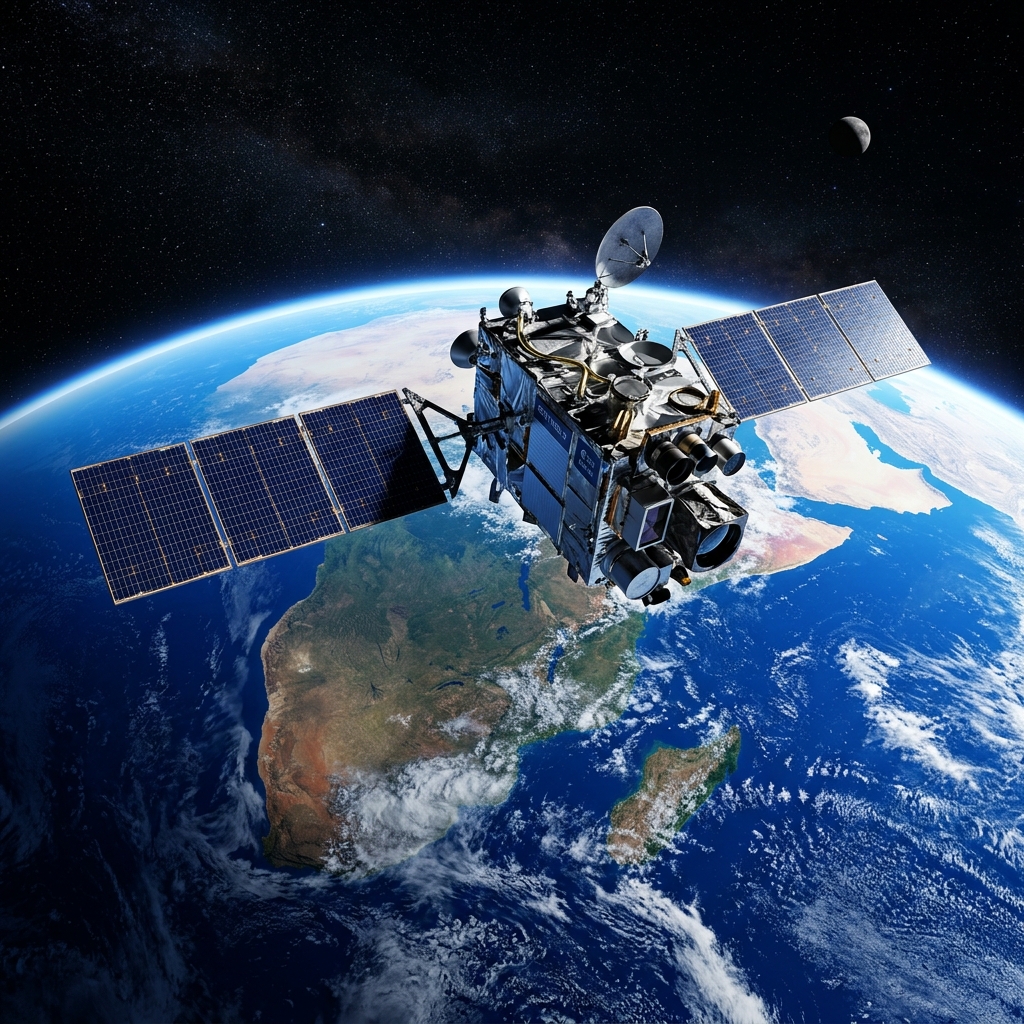
The Overview Effect
 🔍 Click to Zoom
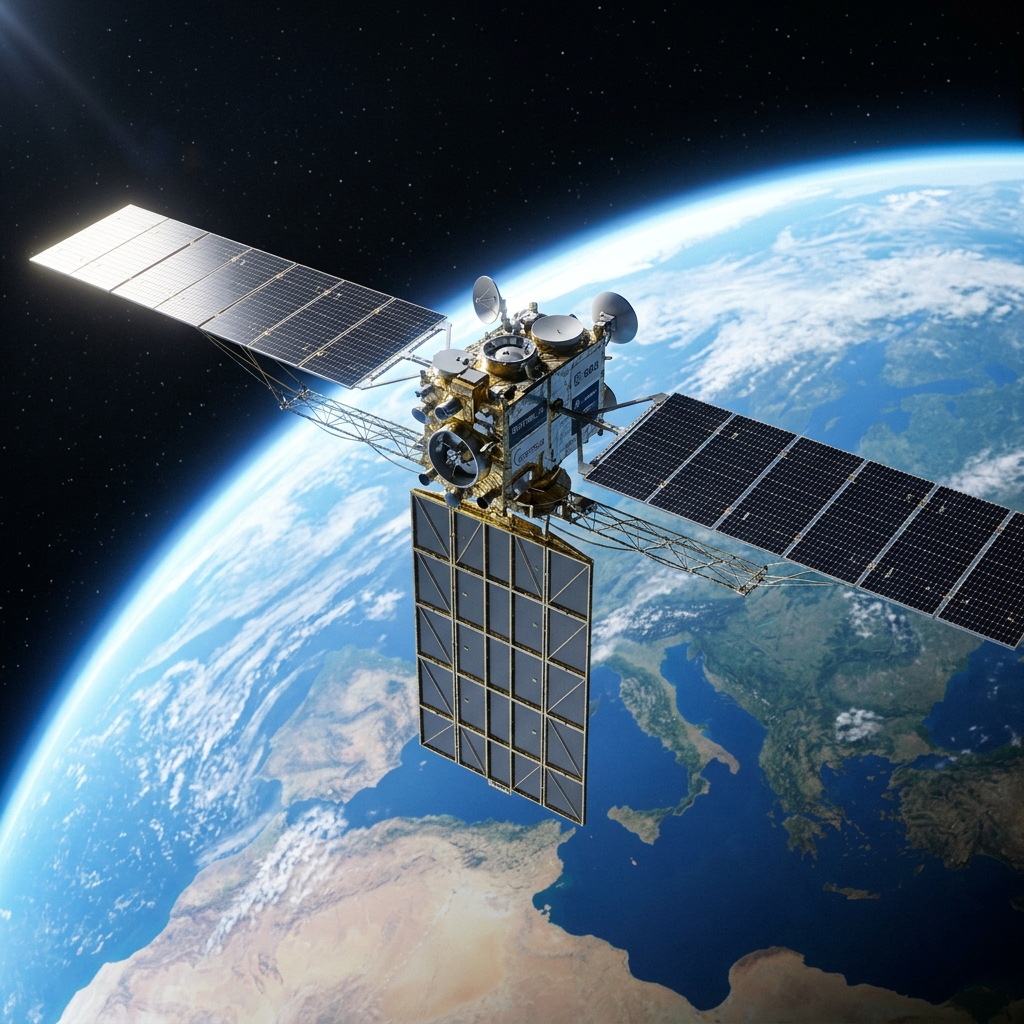
Copernicus & the Sentinels
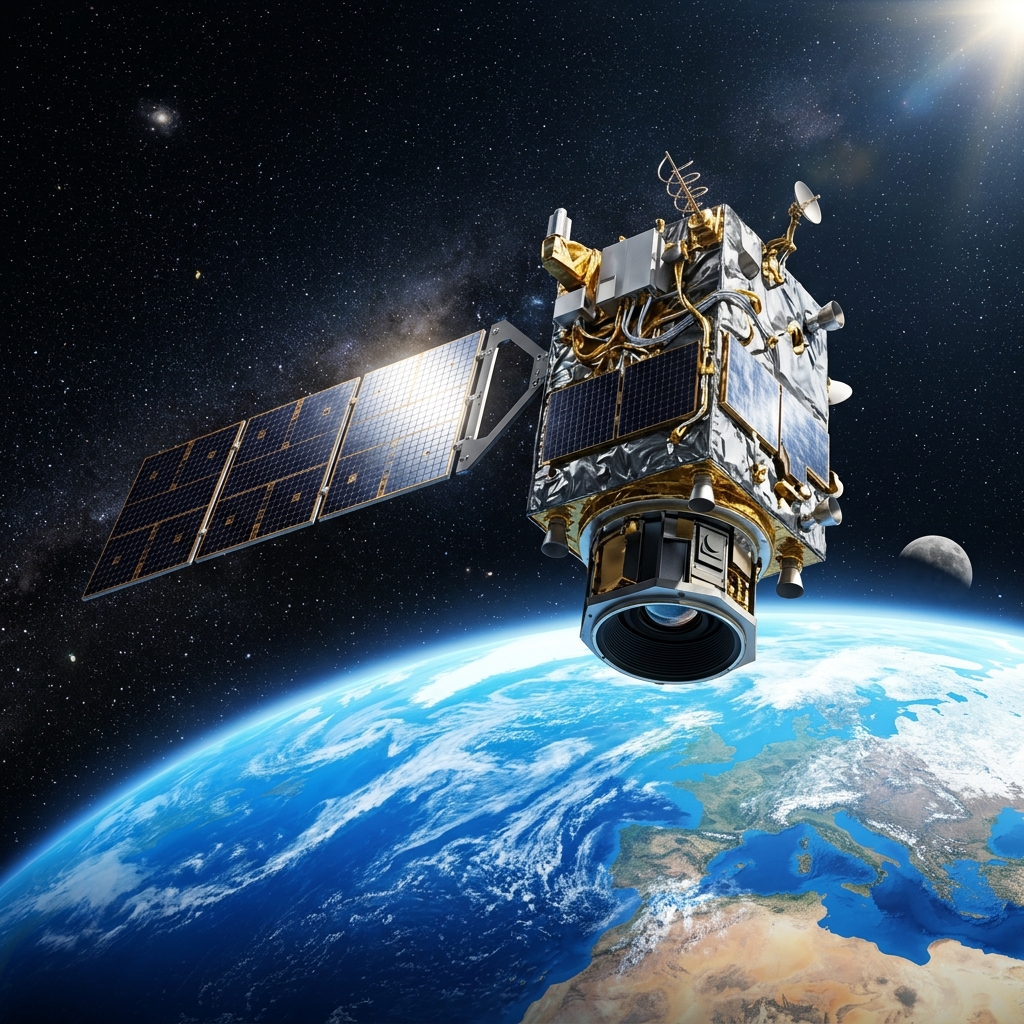
Sentinel-1
C-Band Radar (SAR)
Sees through clouds, day and night. Key for ship detection, oil spill tracking, and mapping changes in coastlines.
Sentinel-2
Multispectral Optical
13 spectral bands. Highly accurate for land classification, vegetation health, and inland/coastal water color.
Sentinel-3
Ocean & Land Color
Wide-swath sensors. Measures sea surface temperature, algal blooms, and coastal water quality parameters.
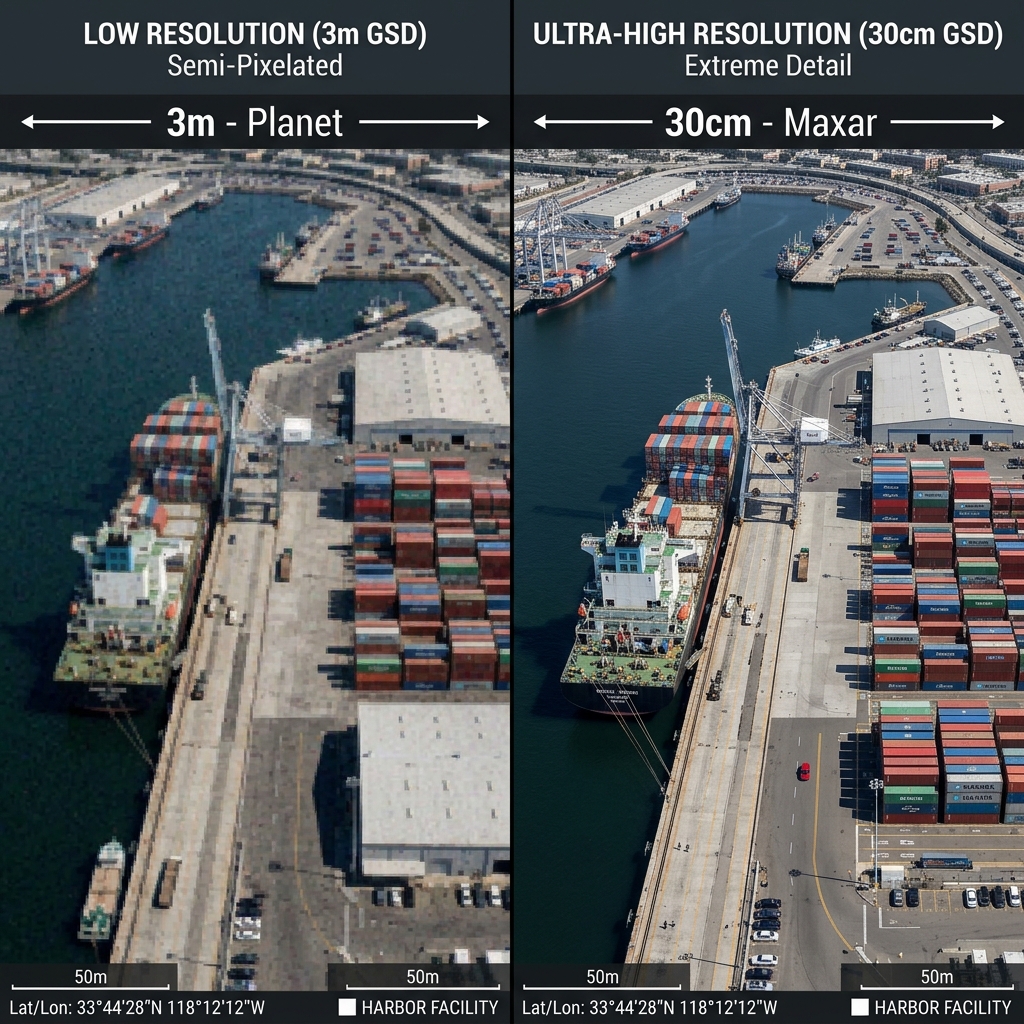
New Space: Planet & Maxar
Planet: Daily Global Coverage
Utilizing a fleet of over 200 Dove CubeSats, Planet images the entire landmass of the Earth every single day.
Maxar: Ultra-High Resolution
Deploying large, high-altitude optical satellites, Maxar captures detailed, task-specific imagery of target regions.
 🔍 Click to Zoom
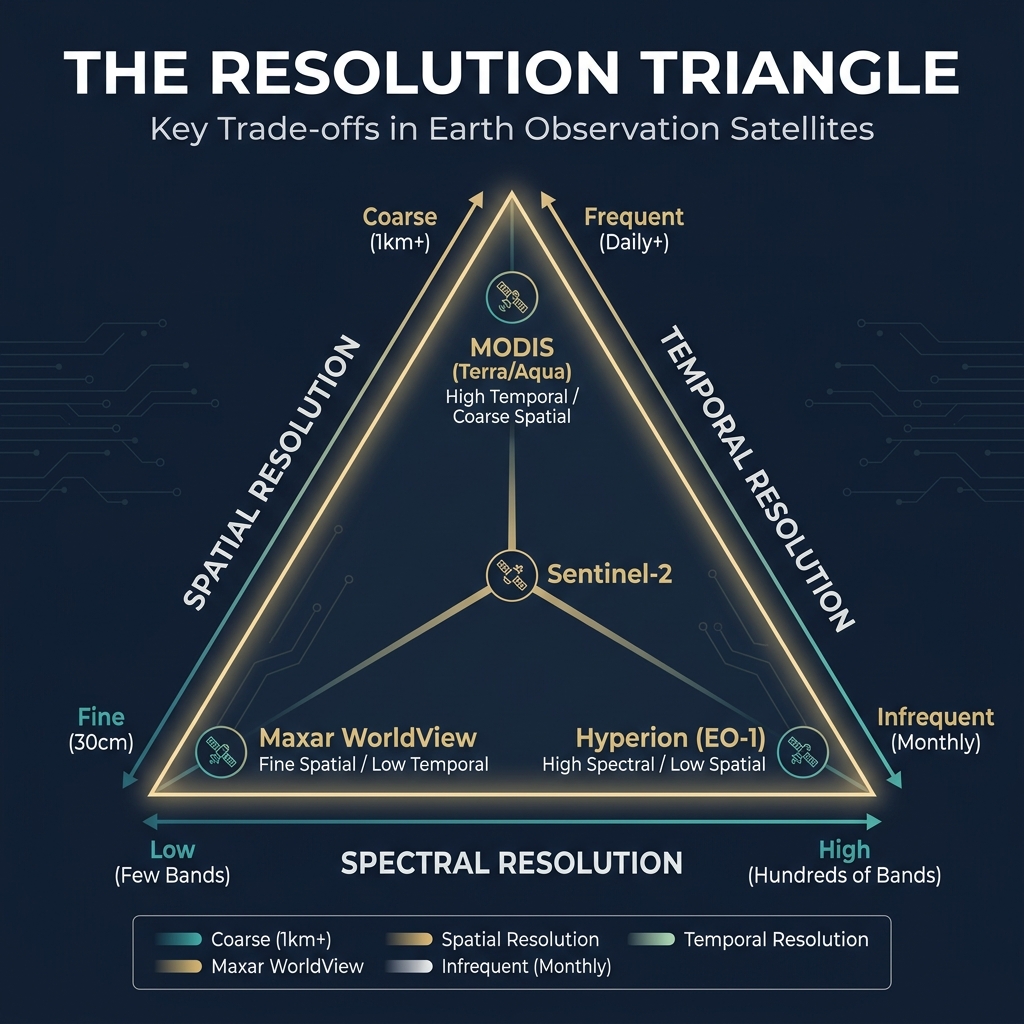
The Three Dimensions of Resolution
What are the three fundamental dimensions of remote sensing resolution?
Data Processing Levels
Level 0 & Level 1: Raw & Top of Atmosphere
Level 0 is raw sensor voltage and raw telemetry. Level 1 is geolocated and calibrated (Top of Atmosphere reflectance) but still contains atmospheric distortion and cloud cover.
Level 2: Surface Reflectance
Atmospherically corrected to represent what a sensor would see on the ground (Bottom of Atmosphere reflectance). This is the clean imagery used by researchers for land classification and vegetation analysis.
Level 3: Geophysical Variables
Processed indices and variables derived from Level 2, such as NDVI (vegetation index), NDWI (water index), or Chlorophyll-A concentrations in water.
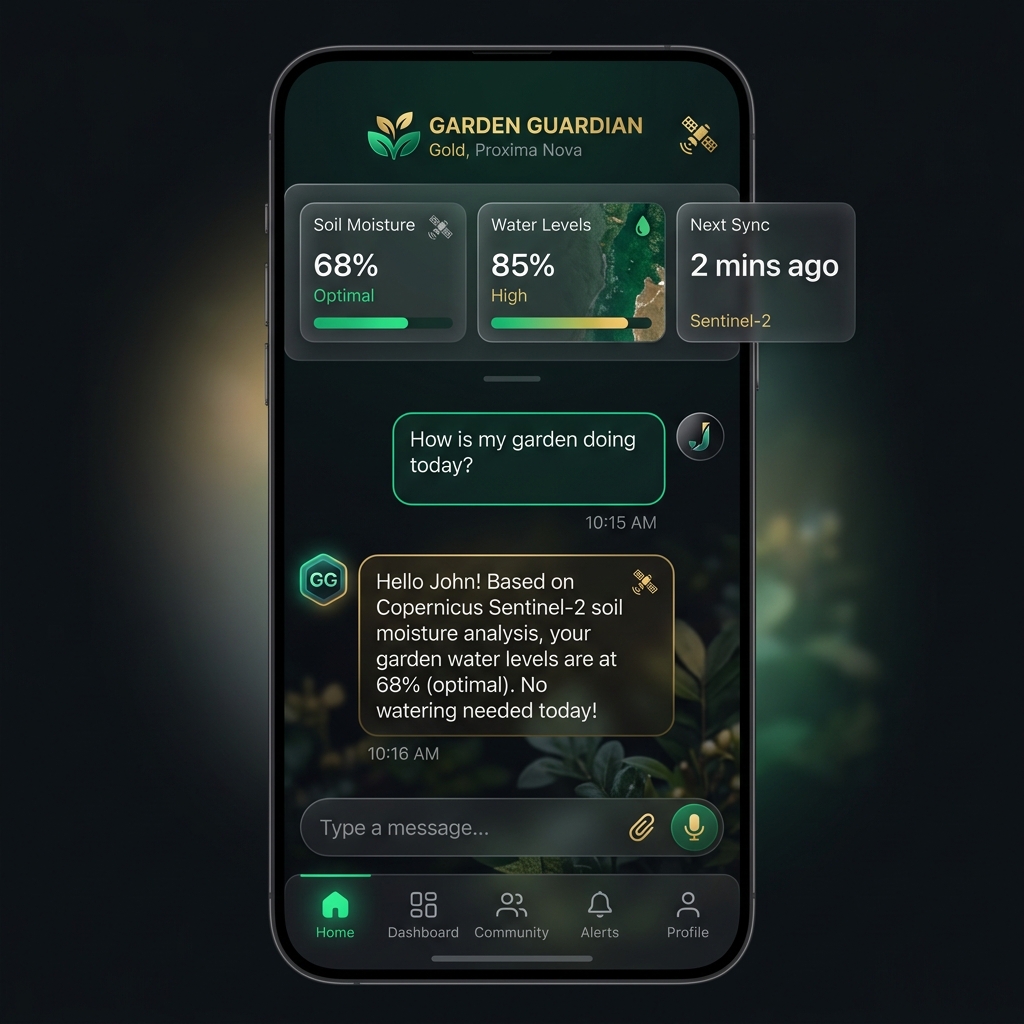
Level 4: Decision Intelligence (The Last Mile)
The ultimate tier. Fusing Level 3 indicators with historical models and AI to output actionable decisions, e.g., "Close this beach due to an active pollution plume."
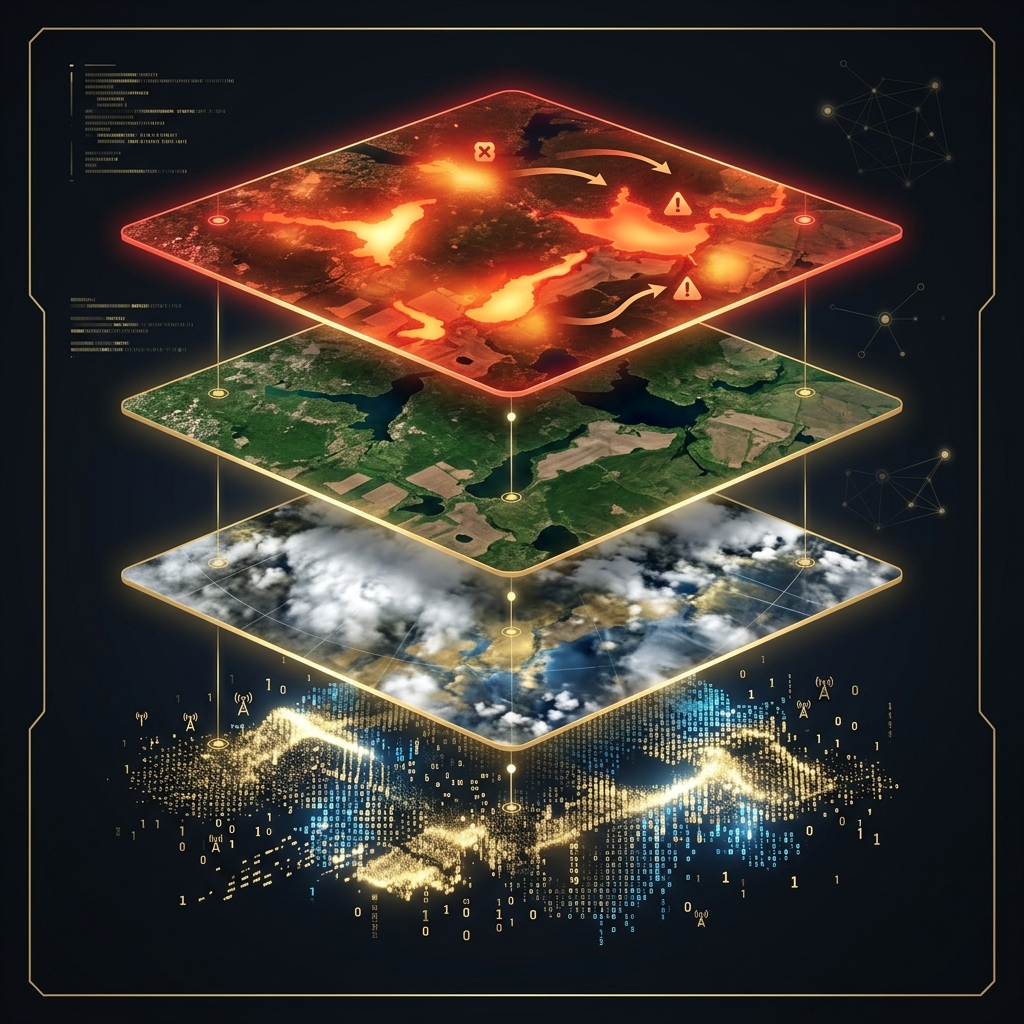
Which data processing level represents atmospherically corrected Surface Reflectance?
Decisions, Not Pixels
 🔍 Click to Zoom
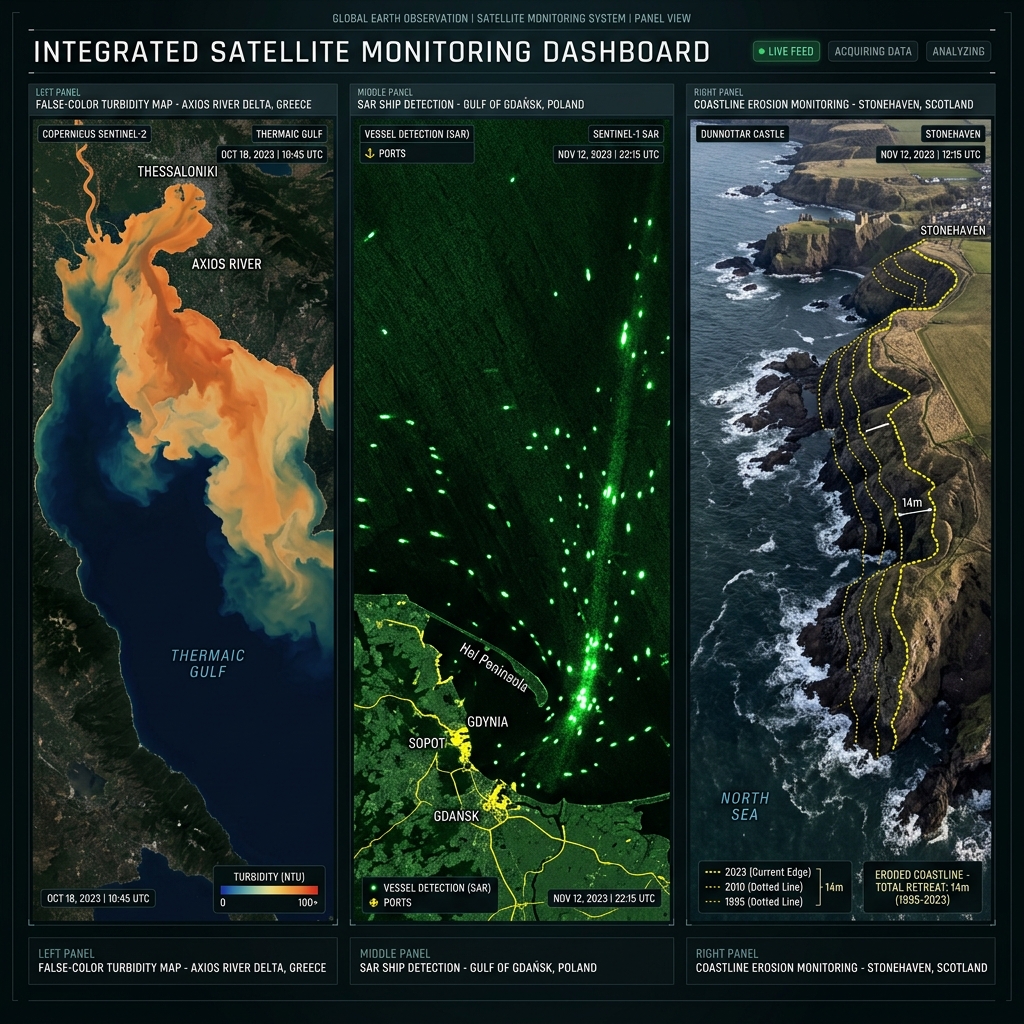
Three Pilots Across Europe
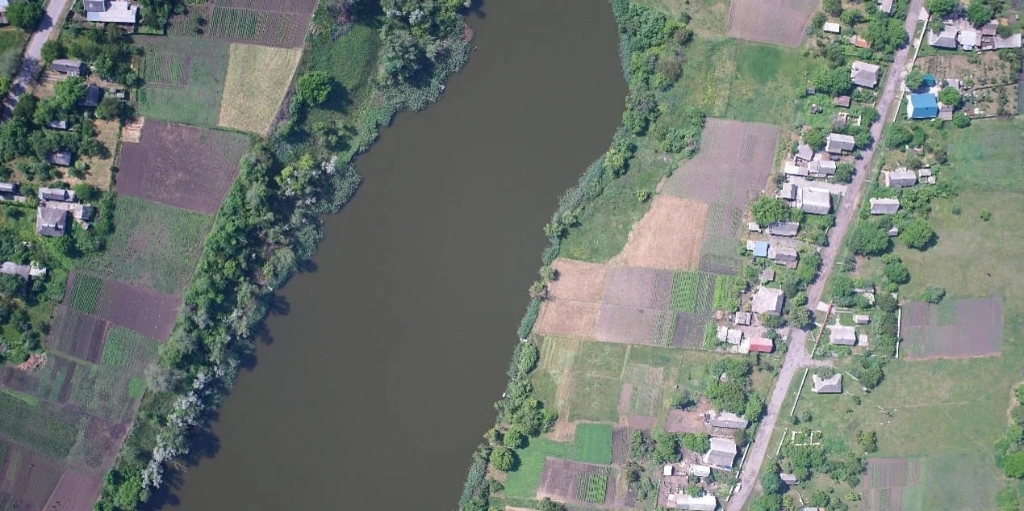
Greece: Water Pollution
Led by University of Thessaly (iPRISM Group). Fuses Sentinel-2/3 with USV drone telemetry to predict agricultural runoff plumes 48 hours in advance in coastal Fthiotida. Explore Demonstrator
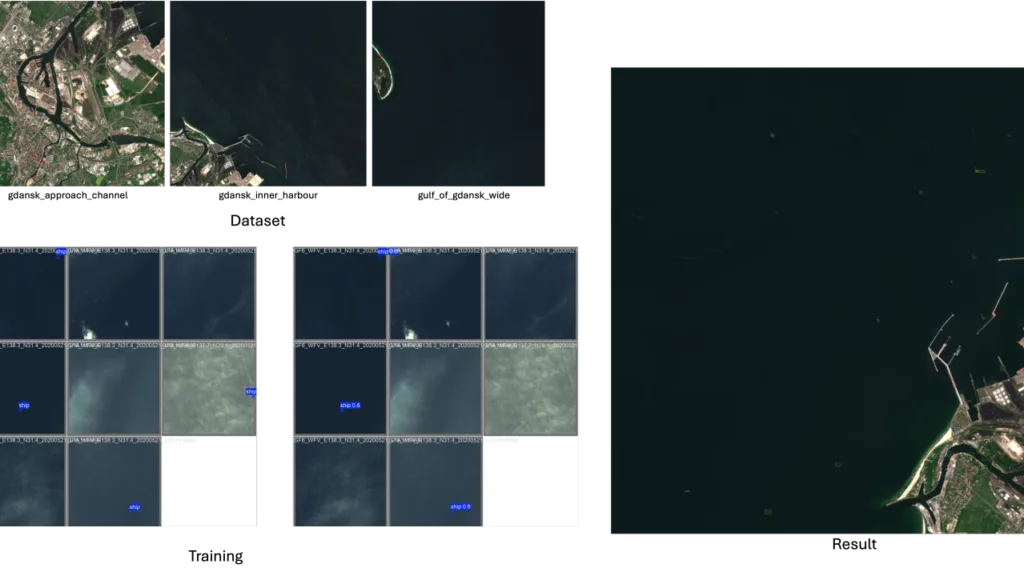
Poland: Maritime Security
Led by Blue Dot Solutions. Fuses Sentinel-1 SAR with AIS logs to track "dark vessels" disabling transponders in the Port of Gdansk, monitoring ship traffic and water quality.
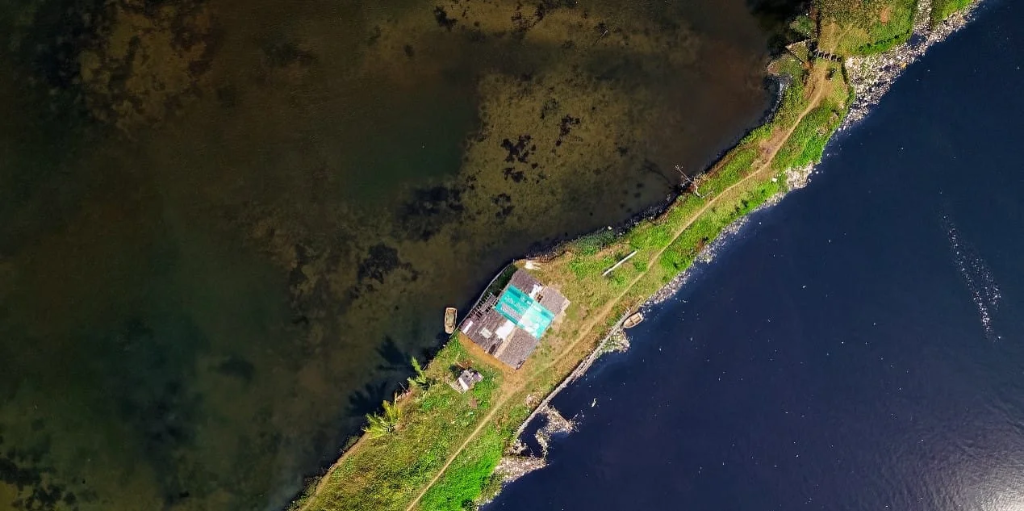
Scotland: Coastal Erosion
Uses Sentinel-1/2 optical and radar imagery to run U-Net/LSTM models to extract shoreline vegetation lines, predicting retreat to protect coastal road infrastructure.
 🔍 Click to Zoom
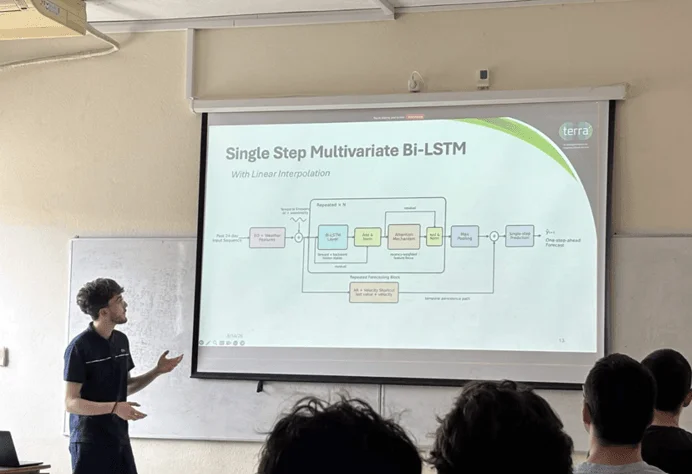
The Intelligence Layer in Action
Fuses Rhine water level gauges with historical models to predict shipping bottlenecks 2 to 4 weeks in advance, suggesting multimodal cargo rerouting via an AI assistant.
Maps corporate assets to satellite observations, converting raw Sentinel-2 and 3 thermal and spectral records into a real-time ESG compliance score per facility.
Builds a centralized, secure space industry marketplace that connects satellite data providers directly with non-expert enterprise customers.
Detects illegal maritime activities by running AI-powered anomaly detection on Sentinel-1 radar, sending automated Telegram alerts to coast guard patrols.
 🔍 Click to Zoom
The GPS Analogy
In which decade was GPS at a similar "expert-only" complexity level as Earth Observation is today?
 🔍 Click to Zoom
Let's Explore Together: Live Stations
Decisions, Not Pixels.
TERRA Webinar
Students are welcome to scan this QR code or watch the TERRA Webinar to see the platform and demonstrators in action!
Latest Project Milestones (June 2026)
6th Project Board Meeting online. Reviewed demonstrator progress and platform integration.
AI Pervasive Systems (iPRISM) lecture at UTH on AI-driven water pollution forecasting.
TERRA Live Showcase at Factory 2026 Workshop, hosted at ISU Strasbourg.