What You'll Learn
- Design user interfaces using the Earth Engine UI API
- Create interactive widgets (selectors, panels, legends)
- Build a split-panel map for comparing images
- Link maps for synchronized pan/zoom
- Publish and share Earth Engine Apps
Why This Matters
Earth Engine Apps enable you to:
- Share your work: Anyone with a web browser can use your analysis
- Reach stakeholders: No coding knowledge required for users
- Create decision tools: Interactive maps for planning and management
- Showcase skills: Build a portfolio of geospatial applications
Before You Start
- Prerequisites: Complete Lab 19 and understand JavaScript basics.
- Estimated time: 90 minutes
- Materials: Earth Engine account (Gmail required for publishing).
Important: Gmail Account Required
Publishing apps requires a Gmail account. University (UFL) accounts may have publishing restrictions. If you've been using your university email, please create a free Gmail account for this lab.
Key Terms
- UI API
- Earth Engine's User Interface API for creating interactive widgets and layouts.
- Widget
- A UI element like a button, slider, dropdown, or label that users can interact with.
- Split Panel
- A layout showing two maps side-by-side with a draggable divider for comparison.
- NLCD
- National Land Cover Database - a Landsat-based land cover classification for the US.
Earth Engine UI Components
| Component | Purpose | Example Use |
|---|---|---|
| ui.Label | Display text | Titles, instructions |
| ui.Select | Dropdown menu | Year selection |
| ui.Button | Clickable action | Run analysis |
| ui.Slider | Value selection | Threshold adjustment |
| ui.Panel | Container/layout | Group widgets |
| ui.SplitPanel | Side-by-side maps | Before/after comparison |
| ui.Map | Map display | Visualization |
Learn more: UI Widgets Guide | UI Panels Guide
Part 1: Get NLCD Image by Year
Create a function to get NLCD land cover for a specific year:
// Get an NLCD image by year
var getNLCD = function(year) {
    // Import the NLCD collection
    var dataset = ee.ImageCollection('USGS/NLCD_RELEASES/2019_REL/NLCD');

    // Filter the collection by year
    var nlcd = dataset.filter(ee.Filter.eq('system:index', year)).first();

    // Select the land cover band
    var landcover = nlcd.select('landcover');
    return ui.Map.Layer(landcover, {}, year);
};
NLCD Epochs: Available years are 2001, 2004, 2006, 2008, 2011, 2013, 2016, and 2019. The 1992 data uses different methodology and is not directly comparable.
Part 2: Create Image Dictionary
Build a dictionary mapping years to their NLCD layers:
// Create a dictionary with each year and its corresponding NLCD layer
var images = {
    '2001': getNLCD('2001'),
    '2004': getNLCD('2004'),
    '2006': getNLCD('2006'),
    '2008': getNLCD('2008'),
    '2011': getNLCD('2011'),
    '2013': getNLCD('2013'),
    '2016': getNLCD('2016'),
    '2019': getNLCD('2019')
};
Part 3: Create Split Panel Maps
Create left and right maps with dropdown selectors:
// Create the left map (shows first year by default)
var leftMap = ui.Map();
leftMap.setControlVisibility(false);
var leftSelector = addLayerSelector(leftMap, 0, 'top-left');

// Create the right map (shows last year by default)
var rightMap = ui.Map();
rightMap.setControlVisibility(true);
var rightSelector = addLayerSelector(rightMap, 7, 'top-right');

// Function to add layer selection widget to a map
function addLayerSelector(mapToChange, defaultValue, position) {
    var label = ui.Label('Select a year:');

    // Function to update the map layer
    function updateMap(selection) {
        mapToChange.layers().set(0, images[selection]);
    }

    // Create dropdown selector
    var select = ui.Select({
        items: Object.keys(images),
        onChange: updateMap
    });
    select.setValue(Object.keys(images)[defaultValue], true);

    // Create control panel
    var controlPanel = ui.Panel({
        widgets: [label, select],
        style: {position: position}
    });

    mapToChange.add(controlPanel);
}
Part 4: Create the Legend
Define NLCD land cover classes and colors:
// Legend configuration
var title = 'NLCD Land Cover Classification';
var position = 'bottom-right';

var dict = {
    'names': [
        '11 Open Water', '12 Perennial Ice/Snow',
        '21 Developed, Open Space', '22 Developed, Low Intensity',
        '23 Developed, Medium Intensity', '24 Developed, High Intensity',
        '31 Barren Land', '41 Deciduous Forest', '42 Evergreen Forest',
        '43 Mixed Forest', '52 Shrub/Scrub', '71 Grassland/Herbaceous',
        '81 Pasture/Hay', '82 Cultivated Crops',
        '90 Woody Wetlands', '95 Emergent Herbaceous Wetlands'
    ],
    'colors': [
        '#466b9f', '#d1def8', '#dec5c5', '#d99282', '#eb0000', '#ab0000',
        '#b3ac9f', '#68ab5f', '#1c5f2c', '#b5c58f', '#ccb879', '#dfdfc2',
        '#dcd939', '#ab6c28', '#b8d9eb', '#6c9fb8'
    ]
};
Part 5: Assemble the App
Tie everything together with a SplitPanel:
// Create legend panel
var legend = ui.Panel({
style: {position: position, padding: '8px 15px'}
});
// Add legend to map (function definition in full code)
addCategoricalLegend(legend, dict, title);
// Create split panel with linked maps
var splitPanel = ui.SplitPanel({
firstPanel: leftMap,
secondPanel: rightMap,
wipe: true,
style: {stretch: 'both'}
});
// Set the SplitPanel as the root UI
ui.root.widgets().reset([splitPanel]);
// Link the maps for synchronized pan/zoom
var linker = ui.Map.Linker([leftMap, rightMap]);
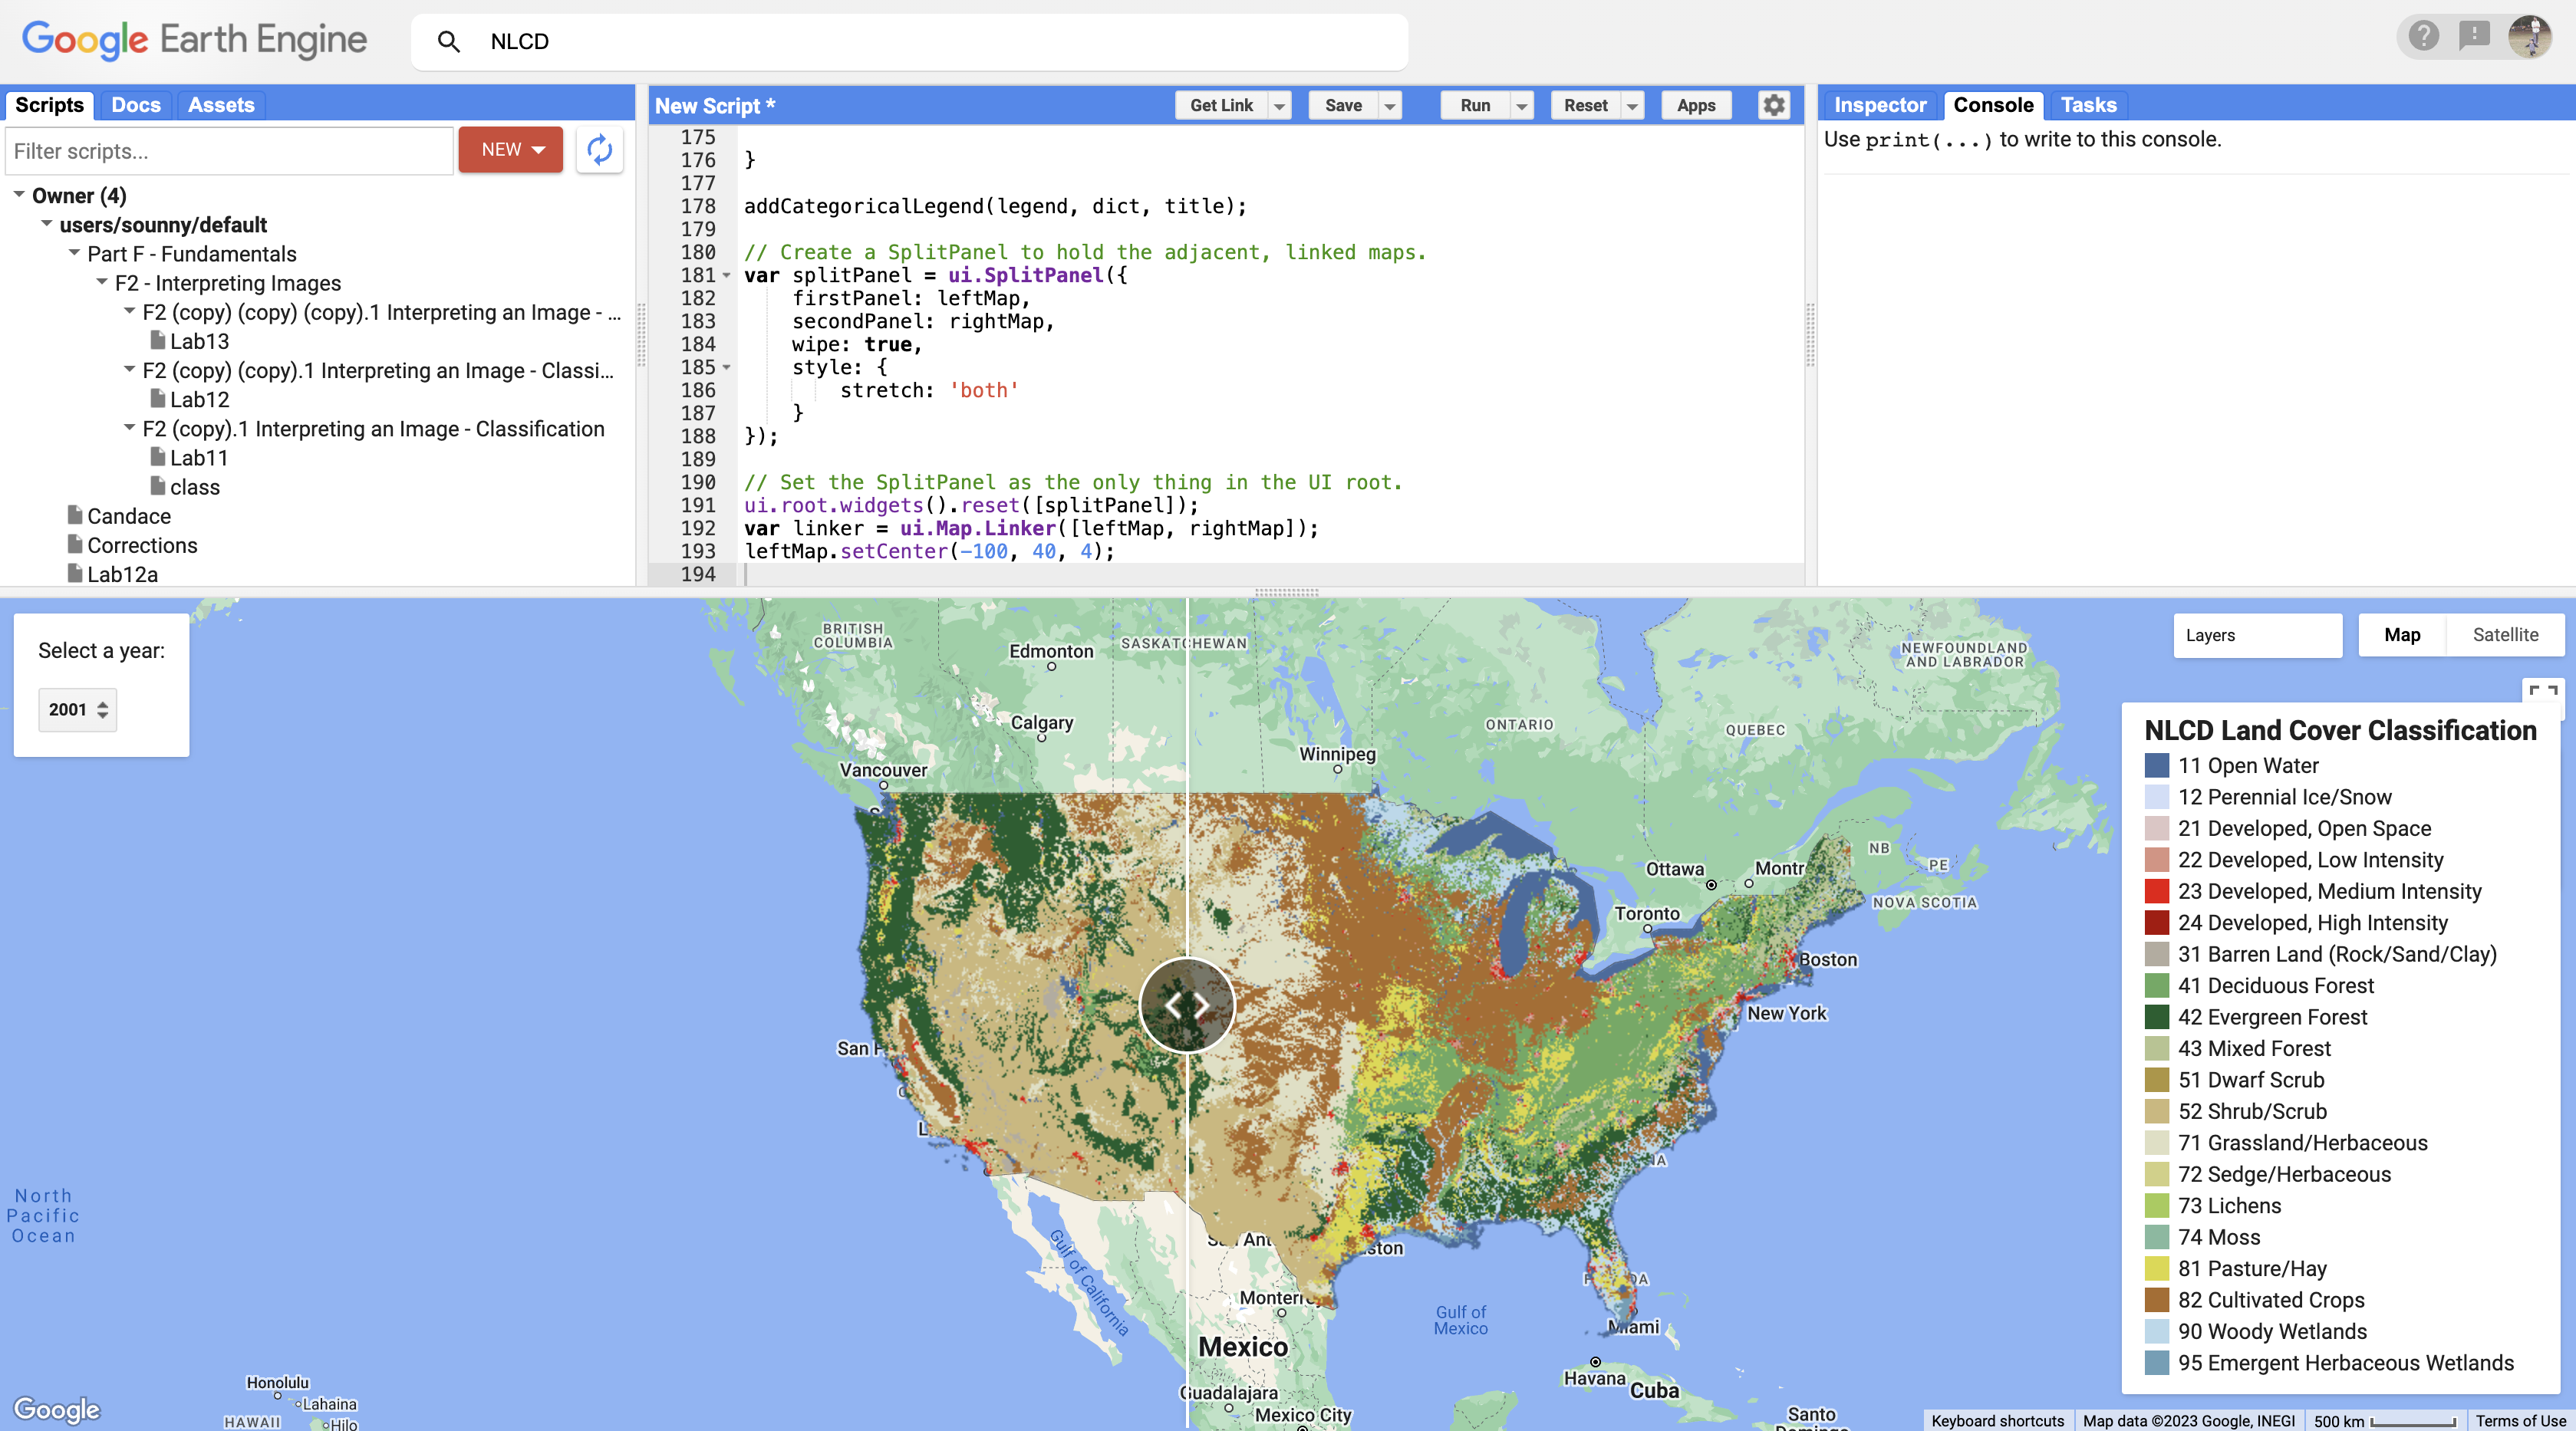
leftMap.setCenter(-100, 40, 4);Expected Result
Your app should look like this - a split panel with synchronized maps:
Part 6: Publish Your App
- Click the Apps button above the script panel
- Click New App
- Name your app (e.g., "NLCD Land Cover Change")
- Select a Google Cloud Project (use defaults if first app)
- Configure source code and appearance
- Click Publish
Example App: https://sounny.users.earthengine.app/view/nlcd
Check Your Understanding
- What is the purpose of the ui.Map.Linker function?
- Why do we set control visibility differently for left and right maps?
- How does the ui.Select widget know which years to show?
- What happens when you drag the split panel divider?
Troubleshooting
Solution: Make sure you're using a Gmail account, not a university account. Create a new Gmail if needed.
Solution: Minimize the Code Editor and maximize the map view. Check that addLayerSelector is called before the panels are used.
Solution: Ensure ui.Map.Linker is created with both maps in the array.
Solution: Wait a few minutes for the app to deploy. Use the Manage Apps panel to check status or update configuration.
Pro Tips
- Add branding: Upload a logo and customize colors in the publish settings
- Test thoroughly: Apps behave differently than the Code Editor - test in a new browser tab
- Version control: Save your script before publishing so you can update later
- User feedback: Add a ui.Textbox or link for users to provide feedback
Key Takeaways
- The UI API enables creation of interactive applications without web development skills
- Split panels are effective for before/after comparisons
- Publishing creates a shareable URL accessible to anyone
- Apps can be updated or deleted from the Manage Apps panel
Challenge: Extend Your App
Try adding these features to your app:
- Add a location search box
- Include additional datasets for comparison
- Add an info panel that appears when clicking on the map
- Create a time slider instead of dropdown menus
📋 Lab Submission
Subject: Lab 20 - GEE Apps - [Your Name]
Submit:
- The URL to your published Earth Engine App
- A shareable URL to your GEE script
- A brief description of your app's purpose