Google Earth Engine exposes its power through an API: you describe the data you want and the computations to run, and GoogleĆs servers do the heavy lifting next to the data. The API lets you analyze massive geospatial datasets without downloading them or managing clusters.
Learning objectives
- Describe what the Earth Engine API does and why it is cloud-first.
- Explain the client (JavaScript/Python) to server workflow and lazy execution model.
- Run a short script that loads data, computes a metric, and renders the result.
- Identify where to go for documentation, debugging help, and next steps.
Why it matters
Think about the scale of the problem: environmental monitoring, disaster response, agriculture, and climate research all need fast answers from petabytes of imagery. The API hides the infrastructure so we can focus on what actually matters: asking good questions and interpreting the results.
Mental model: how Earth Engine runs our code
Understanding this model will save us hours of confusion later. Here is how it works:
- Client vs server: You write scripts locally; computation runs in GoogleĆs data centers next to the imagery.
- Lazy evaluation: API calls build a recipe. Work happens only when you request output (e.g.,
Map.addLayer,print, or an export). - Immutable objects: Operations on
ee.Image,ee.Feature, andee.ImageCollectionreturn new objects; originals stay unchanged. - Reproducibility: Scripts reference catalog IDs and geometries, not local files. Anyone can re-run your code and get the same result.
Pro tips
- Use the Inspector tab to spot-check pixels after each major step.
- Keep test regions small to avoid long server queues.
print()is the safest way to inspect server objects; use.evaluate()only when you truly need client-side values.
Two language clients, one API
The underlying API is the same regardless of language. We will use JavaScript for the in-browser Code Editor (it is the fastest way to start), but the same concepts apply to Python if we want to work in notebooks later.
JavaScript in the Code Editor
- Best for quick exploration, sharing links, and map-based debugging.
- No installs required; runs entirely in the browser.
- UI widgets and charts are built in.
// Minimal NDVI example (Code Editor)
var roi = ee.Geometry.Point([-122.45, 37.75]).buffer(2000);
var sr = ee.Image('LANDSAT/LC08/C02/T1_L2/LC08_044034_20210623')
  .select(['SR_B5', 'SR_B4'], ['NIR', 'RED'])
  .multiply(0.0000275).add(-0.2); // apply scale/offset
var ndvi = sr.normalizedDifference(['NIR', 'RED']).rename('NDVI');
Map.centerObject(roi, 10);
Map.addLayer(ndvi, {min: 0, max: 0.8, palette: ['brown', 'yellow', 'green']}, 'NDVI');
print('NDVI min/max', ndvi.reduceRegion({
  reducer: ee.Reducer.minMax(),
  geometry: roi,
  scale: 30,
  maxPixels: 1e9
}));
Python in notebooks
- Great for pipelines, unit tests, and mixing EE with NumPy/Pandas/GeoPandas.
- Install with
pip install earthengine-api, then authenticate once. - Use
foliumorgeemapfor interactive maps.
import ee
ee.Initialize()
roi = ee.Geometry.Point([-122.45, 37.75]).buffer(2000)
sr = (ee.Image('LANDSAT/LC08/C02/T1_L2/LC08_044034_20210623')
      .select(['SR_B5', 'SR_B4'], ['NIR', 'RED'])
      .multiply(0.0000275).add(-0.2))
ndvi = sr.normalizedDifference(['NIR', 'RED']).rename('NDVI')
stats = ndvi.reduceRegion(
    reducer=ee.Reducer.minMax(),
    geometry=roi,
    scale=30
).getInfo()
print('NDVI min/max:', stats)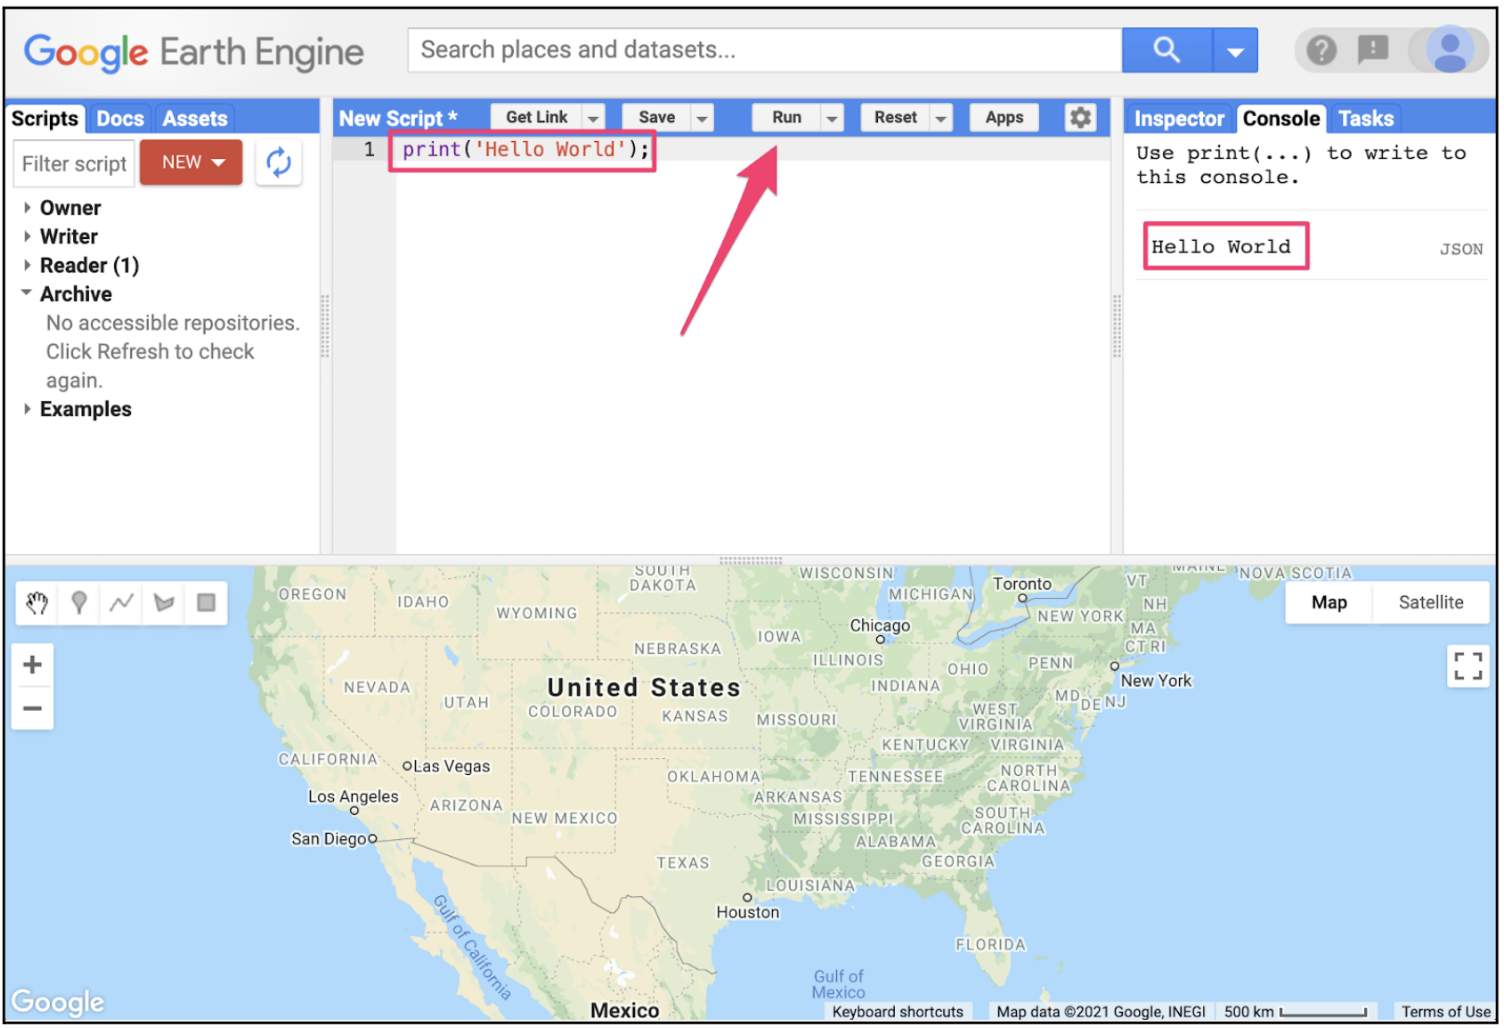
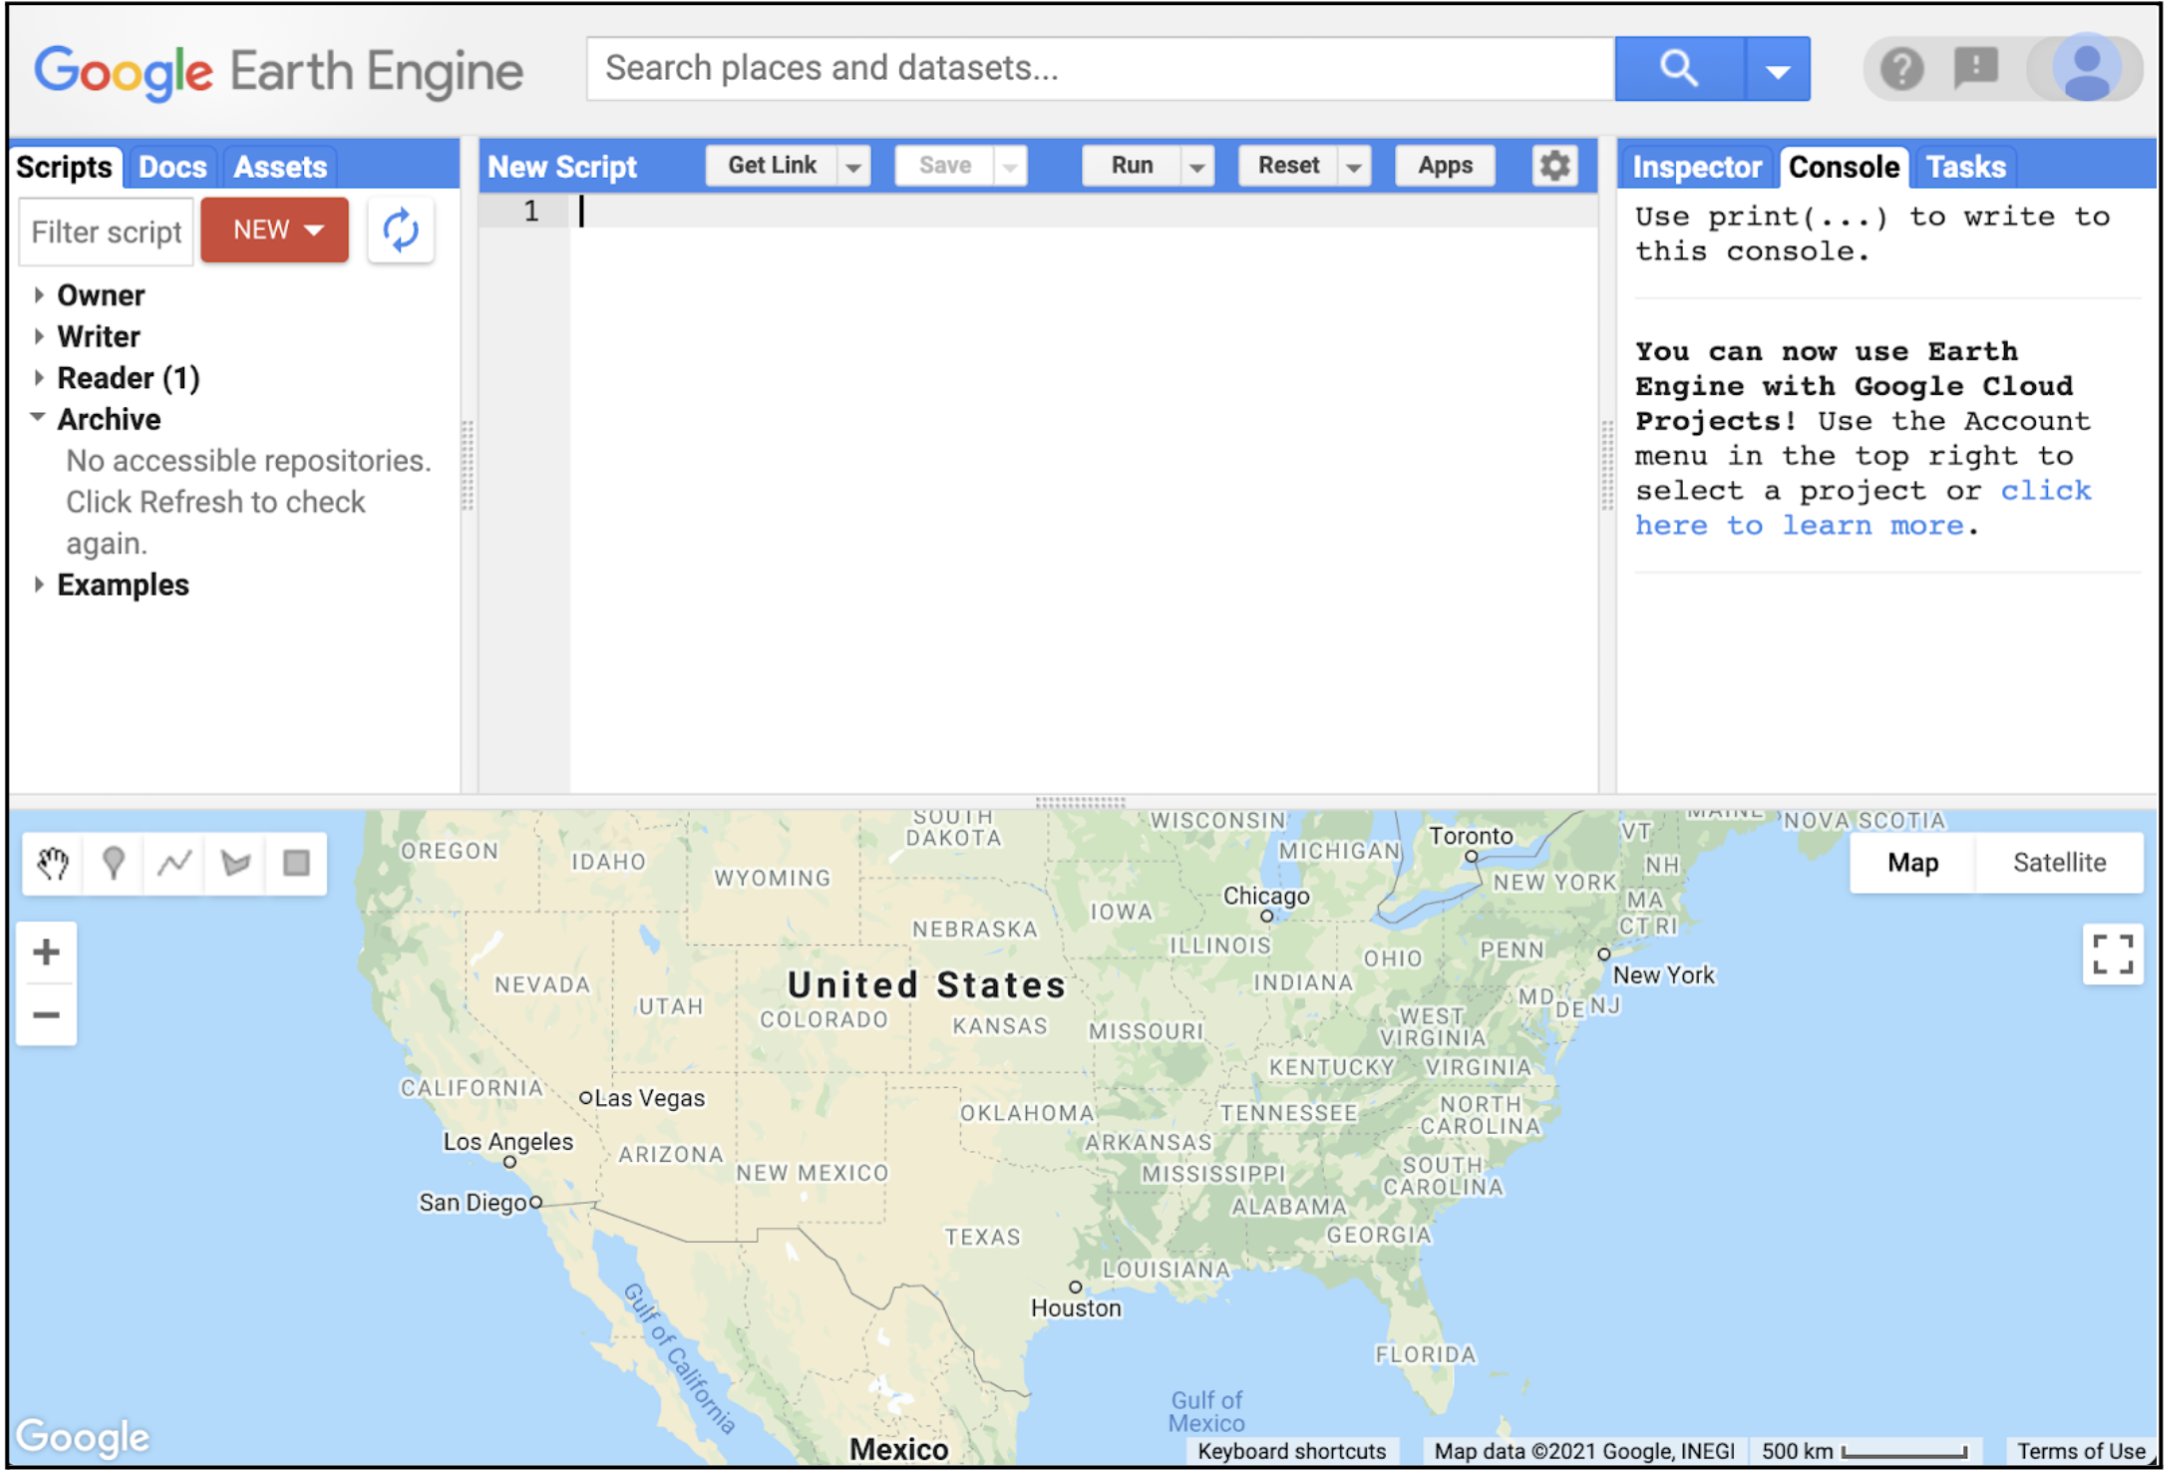
Hands-on: our 10-minute orientation
- Open the Code Editor (sign in if prompted).
- Create a new script, paste the JavaScript example above, and run it.
- Inspect pixels with the crosshair and Inspector tab to see NDVI values.
- Change the
buffersize or palette to see how outputs update. - Click the Docs tab and search for
Image.normalizedDifferenceto read parameters and examples.
What you should see
A green-to-brown NDVI layer centered on the ROI and a console printout with minimum and maximum values.
Try it: small tweaks that build intuition
Swap to another image ID from the same collection (pick a nearby date) and note how NDVI changes.
Replace NDVI with a false-color composite by adding SR_B6 and visualizing with {bands: ['NIR', 'RED', 'SR_B6']}.
Print the image projection (ndvi.projection()) to connect scale units to the map.
Key vocabulary
- API
- A contract that defines the functions and objects you use to ask the server for data and computations.
- Client library
- JavaScript or Python package that implements the API and handles authentication and requests.
- Server-side object
- Placeholder for data living on Earth Engine (e.g.,
ee.Image); it represents work to be done. - Lazy evaluation
- Earth Engine waits to run work until you request output; this keeps scripts fast and composable.
Common mistakes
- Trying to loop over features with client-side
forloops instead of usingmap(). - Forgetting to keep test areas small (large regions can time out when you are prototyping).
- Calling
.getInfo()on huge objects in Python notebooks, which downloads too much data.
Quick self-check
- What triggers Earth Engine to actually execute the graph you built?
- How would you explain the difference between server-side and client-side objects to a classmate?
- Where do you change scale and region when summarizing results?
Where to go next
- Skim the Earth Engine developer guide to see available data types and reducers.
- Follow the API tutorials for more worked examples.
- When stuck, search or post in the Earth Engine Developers forum.
Going Deeper: EEFA Book
This module gives you the foundation. To explore further, see Chapter F1.1 (Introduction to Earth Engine) in the Cloud-Based Remote Sensing with Google Earth Engine (EEFA Book).