Spectral indices are one of the most powerful tools in our remote sensing toolkit. They turn multi-band information into a single number that highlights exactly what we care about: vegetation health, water presence, burn scars, or urban sprawl. They are fast, intuitive, and they power most of the workflows we will build in this course.
Learning objectives
- Explain what a normalized difference index measures.
- Compute NDVI, NDWI, NDBI, NBR, EVI, SAVI, and NDRE in Earth Engine.
- Write custom index functions using
.expression(). - Read band designations for different sensors.
- Choose the right index for your analysis goal.
- Interpret index ranges and common pitfalls.
Why it matters
Think of indices as a translator. Raw satellite bands are like a conversation in a foreign language. Indices translate that conversation into something we can immediately understand: "this pixel is healthy vegetation" or "this area just burned." We can threshold them, compare them over time, or feed them into classifiers, all without heavy modeling.
Quick win: our first NDVI map
Let's start with the classic. NDVI (Normalized Difference Vegetation Index) is the most widely used spectral index in remote sensing. We will compute it on a Landsat 8 image and see vegetation light up in green.
// NDVI example (Landsat 8 Surface Reflectance)
var img = ee.Image('LANDSAT/LC08/C02/T1_L2/LC08_044034_20210623')
  .multiply(0.0000275).add(-0.2); // apply scale/offset
var ndvi = img.normalizedDifference(['SR_B5', 'SR_B4']).rename('NDVI');
Map.centerObject(img, 9);
Map.addLayer(ndvi, {min: 0, max: 0.8, palette: ['brown', 'yellow', 'green']}, 'NDVI');
print('NDVI min/max', ndvi.reduceRegion({
  reducer: ee.Reducer.minMax(),
  geometry: img.geometry(),
  scale: 30,
  maxPixels: 1e9
}));
What you should see
A green-to-brown NDVI layer and console print of min/max values near 0-0.8 for vegetated areas.
Common indices
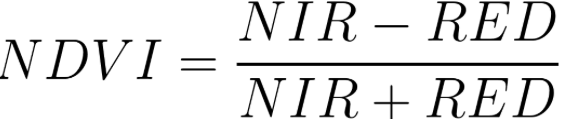
- NDVI = (NIR - RED) / (NIR + RED) - vegetation vigor.
- NDWI = (NIR - SWIR) / (NIR + SWIR) - vegetation water content.
- MNDWI = (GREEN - SWIR) / (GREEN + SWIR) - open water detection.
- NBR = (NIR - SWIR2) / (NIR + SWIR2) - burn severity.
- NDBI = (SWIR - NIR) / (SWIR + NIR) - built-up areas.
Pro tips
- Band names differ by sensor: Landsat 8 NIR=B5, RED=B4; Sentinel-2 NIR=B8, RED=B4.
- Use
.normalizedDifference()to avoid manual formula mistakes. - Mask clouds before computing indices to avoid artifacts.
Try another index: NDWI (Sentinel-2)
var s2 = ee.ImageCollection('COPERNICUS/S2_SR')
  .filterDate('2023-06-01', '2023-06-15')
  .filterBounds(ee.Geometry.Point([-82.3, 29.6]))
  .first();
var ndwi = s2.normalizedDifference(['B8', 'B11']).rename('NDWI');
Map.addLayer(ndwi, {min: -0.5, max: 0.8, palette: ['brown','beige','cyan']}, 'NDWI');
Beyond NDVI: EVI, SAVI, and NDRE
NDVI is great, but it has limits. In dense tropical forests, NDVI maxes out near 0.9 and stops distinguishing between "very green" and "extremely green." In arid landscapes, bare soil confuses the signal. And for precision agriculture, we sometimes need finer sensitivity to chlorophyll than NDVI can offer.
That is where these three advanced indices come in. Each one was designed to solve a specific weakness of NDVI. Let's meet them.
EVI (Enhanced Vegetation Index)
Think of EVI as "NDVI with a correction filter." It reduces atmospheric haze and soil background noise that can throw off NDVI readings. Most importantly, it does not saturate in dense vegetation, which makes it the go-to index for agricultural monitoring and tropical forests.
Formula: EVI = 2.5 × (NIR - RED) / (NIR + 6×RED - 7.5×BLUE + 1)
Notice the Blue band in the formula. That is the atmospheric correction term. It is also why
EVI needs .expression() instead of .normalizedDifference().
// EVI on Sentinel-2
var s2 = ee.ImageCollection('COPERNICUS/S2_SR_HARMONIZED')
  .filterDate('2023-06-01', '2023-06-30')
  .filterBounds(ee.Geometry.Point([-93.5, 42.0]))
  .filter(ee.Filter.lt('CLOUDY_PIXEL_PERCENTAGE', 20))
  .median()
  .divide(10000); // scale to reflectance

var evi = s2.expression(
  '2.5 * ((NIR - RED) / (NIR + 6 * RED - 7.5 * BLUE + 1))',
  {
    NIR: s2.select('B8'),
    RED: s2.select('B4'),
    BLUE: s2.select('B2')
  }
).rename('EVI');

Map.addLayer(evi, {min: 0, max: 0.8, palette: ['brown','yellow','darkgreen']}, 'EVI');
What you should see
Over Iowa cropland, healthy summer crops should show EVI values of 0.4 to 0.8. Bare soil and roads will be near 0. Compare this with NDVI on the same image: where NDVI plateaus at 0.85+, EVI still shows variation between 0.6 and 0.8. That extra detail matters for crop monitoring.
SAVI (Soil-Adjusted Vegetation Index)
SAVI was designed for the places where bare soil shows through the vegetation canopy. Think of arid grasslands in West Texas, sparse shrubland in the Sahel, or a newly planted crop field. In these settings, soil reflectance contaminates NDVI readings, making sparse vegetation look even sparser than it is.
SAVI adds a soil brightness correction factor (L) to compensate. The standard value is L = 0.5, which works well for most intermediate vegetation cover.
Formula: SAVI = ((NIR - RED) / (NIR + RED + L)) × (1 + L), where L = 0.5
// SAVI on Landsat 8
var img = ee.Image('LANDSAT/LC08/C02/T1_L2/LC08_044034_20210623')
  .multiply(0.0000275).add(-0.2);

var savi = img.expression(
  '((NIR - RED) / (NIR + RED + 0.5)) * 1.5',
  {
    NIR: img.select('SR_B5'),
    RED: img.select('SR_B4')
  }
).rename('SAVI');

Map.addLayer(savi, {min: 0, max: 0.7, palette: ['brown','yellow','green']}, 'SAVI');
What you should see
SAVI values typically range from 0 to about 0.7. In areas with dense vegetation, SAVI and NDVI look almost identical. The real difference shows up in sparse vegetation areas: SAVI will be slightly higher than NDVI because it compensates for the soil signal that was dragging NDVI down.
NDRE (Normalized Difference Red Edge)
NDRE is the precision tool. It uses Sentinel-2's red edge band (B5, centered at 705 nm) instead of the visible red band. Why does that matter? The red edge is more sensitive to chlorophyll content than the red band. This means NDRE can detect subtle vegetation stress that NDVI misses entirely.
Think of it this way: NDVI tells us "is there vegetation?" while NDRE tells us "how healthy is that vegetation?" Precision agriculture relies heavily on NDRE for exactly this reason.
Formula: NDRE = (NIR - Red Edge) / (NIR + Red Edge)
Important: NDRE only works with Sentinel-2 (and a few other sensors that have a red edge band). Landsat does not have a red edge band, so NDRE cannot be computed from Landsat imagery.
// NDRE on Sentinel-2 (only works with Sentinel-2, not Landsat)
var ndre = s2.normalizedDifference(['B8', 'B5']).rename('NDRE');
Map.addLayer(ndre, {min: 0, max: 0.6, palette: ['red','yellow','green']}, 'NDRE');
What you should see
NDRE values are similar to NDVI but with finer sensitivity to vegetation health. Healthy crops show NDRE of 0.3 to 0.6. Stressed vegetation shows lower values even when NDVI still appears normal. This early warning capability is what makes NDRE so valuable for farm management.
When to use which?
Here is a quick mental model:
- NDVI: The everyday workhorse. Use it when vegetation cover is moderate and soil is not a concern.
- EVI: The upgraded model. Use it for dense forests, cropland, or anywhere NDVI saturates above 0.85.
- SAVI: The desert specialist. Use it when more than 30% of the ground is bare soil.
- NDRE: The precision instrument. Use it for crop stress detection and precision agriculture (Sentinel-2 only).
Writing Custom Index Functions
Once we understand the formulas, the next step is to wrap them in reusable functions.
This way, we can .map() our index over an entire collection with a single line
of code. Let's see how.
// Reusable function to compute EVI for any Sentinel-2 image
function computeEVI(image) {
  var scaled = image.divide(10000); // scale to reflectance first
  return scaled.expression(
    '2.5 * ((NIR - RED) / (NIR + 6 * RED - 7.5 * BLUE + 1))',
    {
      NIR: scaled.select('B8'),
      RED: scaled.select('B4'),
      BLUE: scaled.select('B2')
    }
  ).rename('EVI')
   .copyProperties(image, ['system:time_start']);
}

// Apply to a collection
var eviCollection = ee.ImageCollection('COPERNICUS/S2_SR_HARMONIZED')
  .filterDate('2023-01-01', '2023-12-31')
  .filterBounds(ee.Geometry.Point([-82.3, 29.6]))
  .filter(ee.Filter.lt('CLOUDY_PIXEL_PERCENTAGE', 20))
  .map(computeEVI);

print('EVI collection size:', eviCollection.size());
Pro tips
- Wrap index calculations in reusable functions so you can
.map()them over collections. - Use
.expression()for complex formulas; use.normalizedDifference()for simple (A-B)/(A+B) indices. - Always
.rename()the output so band names are meaningful.
Which Index Should I Use?
Use this decision table to choose the right index for your analysis:
| Goal | Best Index | Why |
|---|---|---|
| General vegetation mapping | NDVI | Simple, well-understood, works for most vegetation |
| Dense vegetation or crops | EVI | Does not saturate in high biomass areas |
| Sparse/arid vegetation | SAVI | Corrects for bare soil influence |
| Crop health and stress | NDRE | Sensitive to chlorophyll (Sentinel-2 only) |
| Open water detection | MNDWI | Best contrast between water and non-water |
| Burn severity | NBR | Sensitive to burned vegetation and soil |
| Built-up / urban areas | NDBI | Highlights impervious surfaces |
Try it: compare NDVI vs EVI on dense forest
Compute both NDVI and EVI for a tropical forest area. Notice how NDVI saturates near 0.9 while EVI still shows variation.
// Compare NDVI and EVI for the same Sentinel-2 image
var ndvi = s2.normalizedDifference(['B8', 'B4']).rename('NDVI');
var evi = s2.expression(
  '2.5 * ((NIR - RED) / (NIR + 6 * RED - 7.5 * BLUE + 1))',
  {NIR: s2.select('B8'), RED: s2.select('B4'), BLUE: s2.select('B2')}
).rename('EVI');
Map.addLayer(ndvi, {min: 0, max: 1, palette: ['brown','green']}, 'NDVI');
Map.addLayer(evi, {min: 0, max: 0.8, palette: ['brown','darkgreen']}, 'EVI');
Common mistakes
- Using wrong band numbers for a sensor (check the Data Catalog).
- Forgetting to scale/offset surface reflectance before computing indices.
- Interpreting raw index values without masking clouds/shadows.
- Using NDRE with Landsat (Landsat does not have a red edge band).
- Forgetting the soil correction factor (L=0.5) in SAVI.
Quick self-check
- What range do normalized difference indices fall within?
- Which bands would you use for NBR on Landsat 8?
- Why should you cloud-mask before computing an index?
- When would you choose EVI over NDVI?
- Why can NDRE only be computed from Sentinel-2?
- What does the
.expression()function allow you to do that.normalizedDifference()cannot?
Going deeper
This module covers the most common spectral indices. For advanced image transformations, see:
Next steps
- Compute NDVI and NDWI on the same scene; compare histograms and maps.
- Test MNDWI on a coastal area to isolate water bodies.
- Write a reusable function that computes EVI for any Sentinel-2 image and
.map()it over a collection. - Read the Earth Engine docs for
normalizedDifferenceandexpression.