Discrete vs Continuous Data
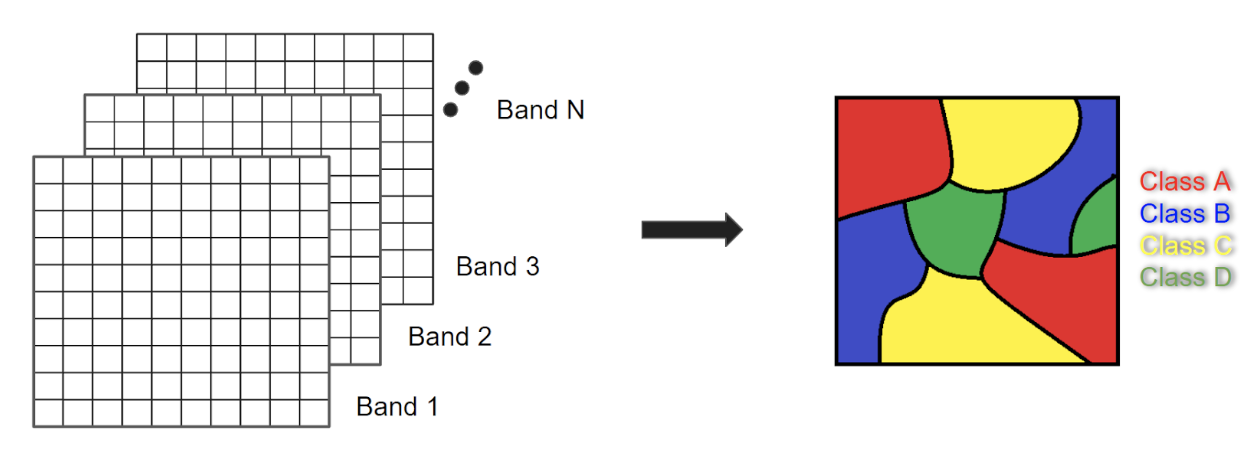
Figure: Transformation from continuous multi-band imagery to discrete classified image
Understanding Data Types
Before diving into image classification, it's essential to understand the fundamental difference between discrete and continuous data, as this distinction forms the basis of how we transform raw satellite imagery into meaningful thematic maps.
Discrete Data
Discrete data refers to data that can only take on certain numerical values, often integers. This type of data is limited to a finite number of possible outcomes. It is typically used to represent counts or whole numbers.
Examples of discrete data:
- Number of people in a household
- Number of students in a class
- Number of cars in a parking lot
- Land cover classes (1 = water, 2 = forest, 3 = urban, etc.)
- Count of buildings in an image
Continuous Data
Continuous data can take on any value within a given range or interval. This type of data is often measured and can include fractions or decimals.
Examples of continuous data:
- Temperature (e.g., 25.3°C, 78.6°F)
- Weight (e.g., 150.5 lbs, 68.2 kg)
- Elevation (e.g., 1,234.5 meters)
- NDVI values (ranging from -1 to +1)
- Surface reflectance (0 to 1)
Application in Machine Learning
In the context of machine learning, the distinction between discrete and continuous data determines which type of model we use:
Regression Models
- Predict: Continuous variables
- Output: A numerical value on a continuous scale
- Example: Predicting the price of a house based on its features (size, location, age, etc.)
- In Remote Sensing: Estimating biomass, temperature, or soil moisture
Classification Models
- Predict: Discrete or categorical variables
- Output: A finite number of categories or classes
- Example: Predicting whether a customer will purchase a product based on demographic information
- In Remote Sensing: Classifying pixels into land cover types (water, forest, urban, agriculture)
Classification in Remote Sensing
In remote sensing, image classification is the process of categorizing every pixel in an image into a limited number of labeled land cover and/or land use classes. This resulting classified image provides a simplified thematic map.
The Transformation Process
Classification is fundamentally about transforming continuous data into discrete data:
Continuous Input: Multi-band satellite imagery with continuous reflectance values (e.g., Band 1: 0.25, Band 2: 0.38, Band 3: 0.42, etc.)
??
Classification Algorithm: Analyzes spectral signatures and patterns
??
Discrete Output: Thematic map with discrete class labels (1 = Water, 2 = Forest, 3 = Urban, 4 = Agriculture, etc.)
Why This Matters
Understanding the discrete vs. continuous distinction is critical because:
- Method Selection: Determines whether you use classification or regression techniques
- Data Interpretation: Helps you understand what our results represent
- Accuracy Assessment: Different metrics apply (confusion matrix for discrete, RMSE for continuous)
- Visualization: Discrete data uses categorical color schemes, continuous data uses gradients
- Analysis Capabilities: Some operations require discrete data (e.g., zonal statistics by class), others require continuous (e.g., surface modeling)
Examples in Earth Engine
Working with Continuous Data
// Calculate NDVI (continuous output: -1 to +1)
var ndvi = image.normalizedDifference(['B5', 'B4']);

// Get temperature data (continuous: values in Kelvin)
var lst = image.select('LST_Day_1km');
Working with Discrete Data
// Load land cover classification (discrete: integer class codes)
var landcover = ee.Image('USGS/NLCD/NLCD2019').select('landcover');

// Classify image (convert continuous to discrete)
var classified = image.classify(classifier);

// Reclassify into simpler categories (discrete to discrete)
var simplified = classified.remap([1,2,3,4,5], [1,1,2,2,3]);
Key Takeaways
- ? Discrete data has a finite set of possible values (categories, classes, counts)
- ? Continuous data can take any value within a range (measurements, indices)
- ? Regression predicts continuous variables
- ? Classification predicts discrete variables
- ? Image classification transforms continuous satellite data into discrete thematic maps