Normalized Difference Vegetation Index (NDVI) is a widely used remote sensing tool that measures an area's vegetation health and productivity. NDVI is calculated from multispectral satellite imagery or aerial photographs' red and near-infrared (NIR) bands. It provides information on the amount of green vegetation in a particular area. NDVI has become an important tool in many applications, including agriculture, forestry, ecology, and climate research. It allows for monitoring and assessing vegetation health and growth, detecting drought stress, and identifying changes in land cover and land use.
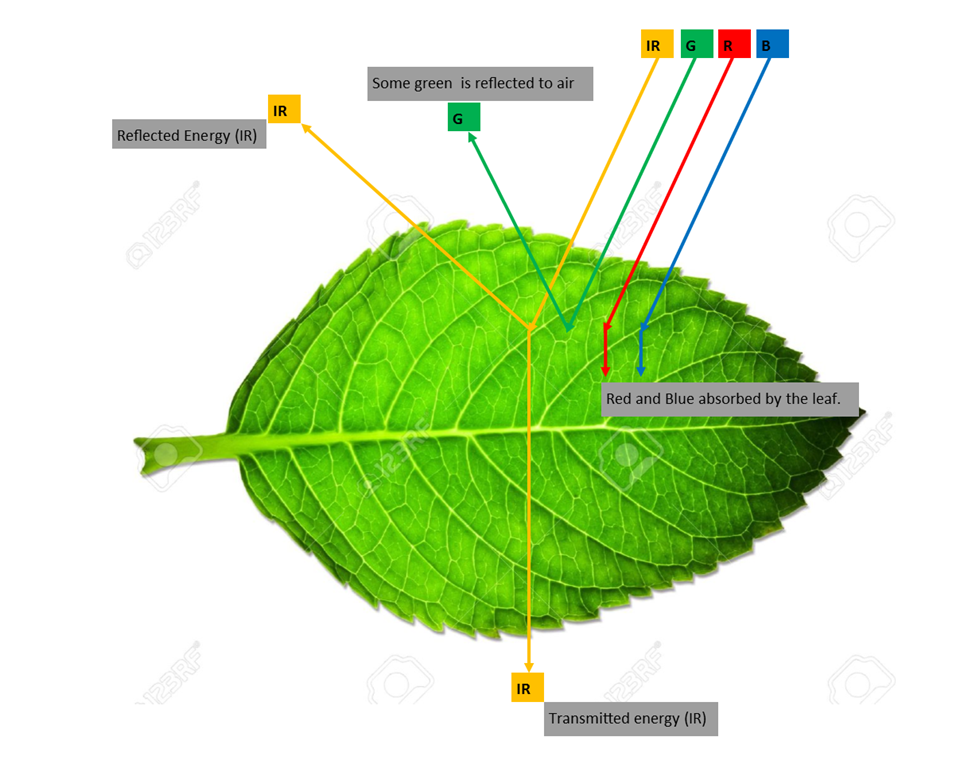
To better understand NDVI, you can look at the following leaf figure. Examining the diagram and how different parts of the electromagnetic spectrum respond to light. Green and IR light is reflected, whereas Red and Blue light is absorbed. Because of the leaf's qualities and the nature of light, we can measure the rate of photosynthetic activity through the intensity of the light.
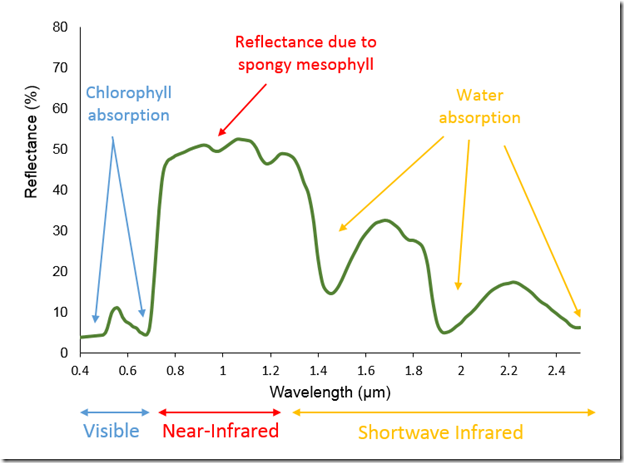
Now let's look at how this translates to the reflectance of the electromagnetic spectrum. See the figure bellow. The red and near-infrared bands provide much information about vegetation due to vegetation’s high reflectance in these wavelengths. Look at the Figure and note, in particular, that vegetation curves (graphed in green) have relatively high reflectance in the NIR range (approximately 750–900 nm). Also note that vegetation has low reflectance in the red range (about 630–690 nm), where chlorophyll absorbs sunlight. This suggests that if the red and near-infrared bands could be combined, they would provide important information about vegetation.
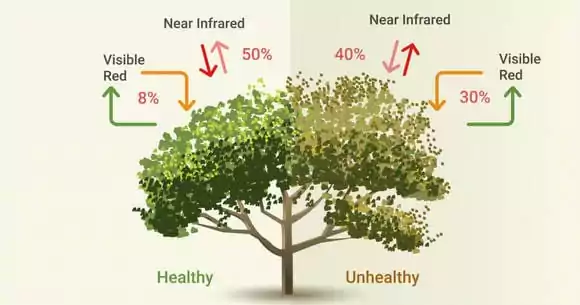
For example, if you look at the diagram below, you will see that different vegetation health will have other reflectance profiles. Due to this, NDVI is an excellent measurement of the general health of a vegetation ecosystem.
Soon after the launch of Landsat 1 in 1972, analysts worked to devise a robust single value that would convey the health of vegetation along a scale of −1 to 1. This yielded the NDVI using the formula. NDVI is a ratio between the reflectance difference in the red and NIR bands divided by their sum. The formula for NDVI is:
NDVI = (NIR - Red) / (NIR + Red)
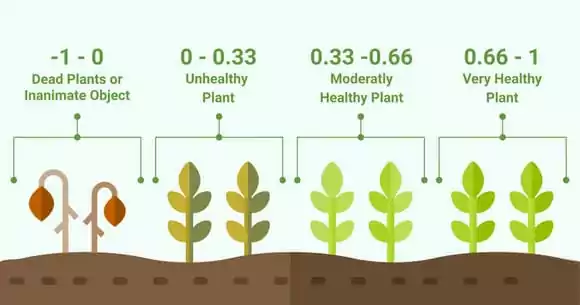
In this formula, NIR represents the reflectance in the near-infrared band, and Red represents the reflectance in the red band. NDVI values range from -1 to +1, where negative values indicate water bodies, bare soil, or urban areas, and positive values indicate healthy green vegetation. The closer the NDVI value is to +1, the healthier the vegetation is. This brightness might be conveyed in units of reflectance, radiance, or digital number (DN); the NDVI is intended to give nearly equivalent values across platforms that use these wavelengths. The general form of this equation is called a “normalized difference”—the numerator is the “difference” and the denominator “normalizes” the value. Outputs for NDVI vary between −1 and 1. High amounts of green vegetation have values around 0.8–0.9. Absence of green leaves gives values near 0, and water gives values near −1.