Spectral indices in remote sensing are an important tool for analyzing data from satellites. This technique harnesses the physics of solar radiation and the energy reflected from objects in different wavelengths to gain new insight to the phenomenon. Spectral indices are based on the fact that different objects and land covers on the Earth’s surface reflect different amounts of light from the Sun at different wavelengths. Spectral indices provide a way to quantify the differences between these wavelengths in visible and infrared light, which can be used to identify objects, features, and patterns on the Earth's surface.
In the visible part of the spectrum, for example, a healthy green plant reflects a large amount of green light while absorbing blue and red light—which is why it appears green to our eyes. Light also arrives from the Sun at wavelengths outside what the human eye can see, and there are large differences in reflectances between living and nonliving land covers and between different types of vegetation, both in the visible and outside the visible wavelengths. We visualized this earlier in Lab 2 - Hello LandSat! when we mapped color-infrared images.
The spectrum of visible light is composed of red, green, blue wavelengths, while infrared light is divided into shortwave and longwave. When light is reflected off of an object, its spectral profile can be used to identify the composition of the object. For example, green plants typically reflect more shortwave infrared than longwave, while the opposite is true for the soil and rocks. By examining the spectral profile of an area, scientists can identify differences in vegetation, land use, and other features on the Earth's surface.
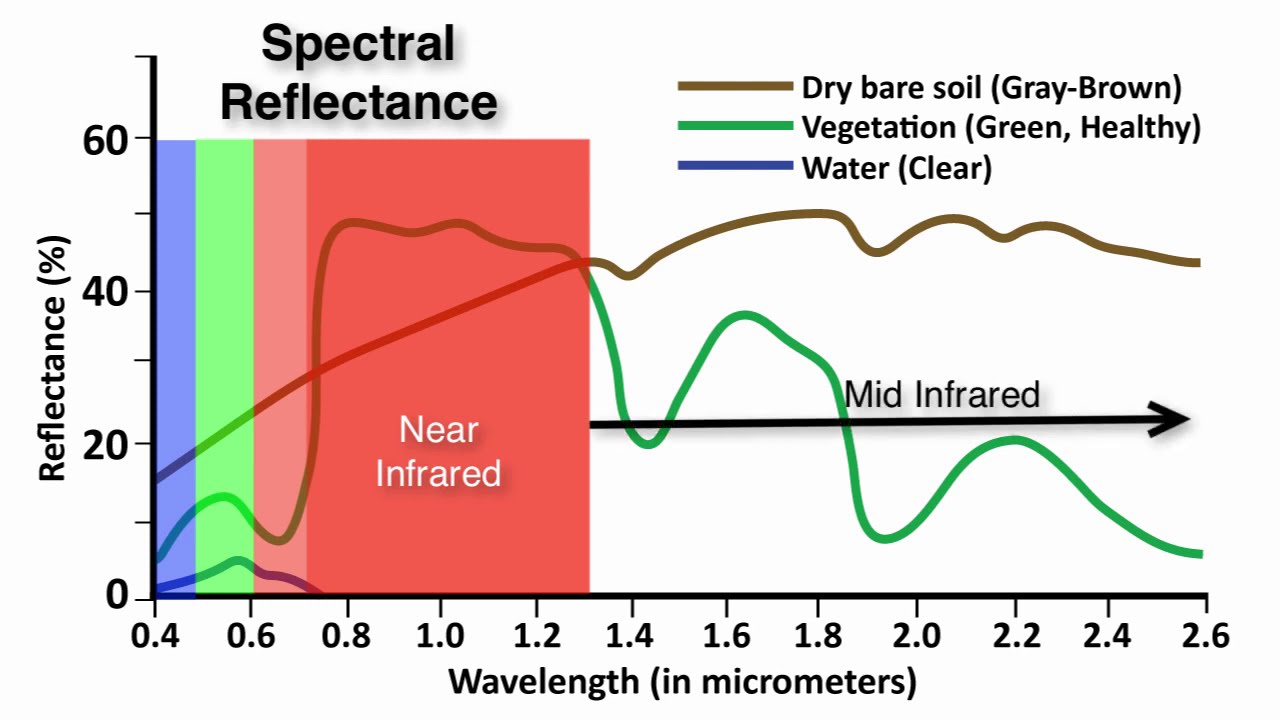
If we graph the amount of light (reflectance) at different wavelengths that an object or land cover reflects, we can visualize this more easily (see the figure) For example, look at the reflectance curves for dry bare soil and water in the graph below. Soil and water both have relatively low reflectance at wavelengths around 400 nm (blue light). Conversely, at wavelengths above 700 nm (red and infrared light) soil has relatively high reflectance, while water has very low reflectance. Vegetation, meanwhile, generally reflects large amounts of near-infrared light, relative to other land covers. Remote Sensing Scientists use these characteristics to do image interpretation gaining insight into digital imagery collected.
Spectral indices can also be used to assess the health and productivity of vegetation. By analyzing spectral data from an area, scientists can identify changes in the chlorophyll content of plants, which can be used to assess the health of crops or forests. In addition, spectral indices can be used to detect various types of pollution and other environmental conditions.
Spectral indices use math to express how objects reflect light across multiple portions of the spectrum as a single number. Indices combine multiple bands, often with simple operations of subtraction and division, to create a single value across an image that is intended to help to distinguish particular land uses or land covers of interest.
A famous example of a spectral index is NDVI (Normalized Difference Vegetation Index). NDVI is a tool used in remote sensing to identify areas with healthy vegetation and to monitor changes in vegetation over time. It is commonly used to measure the health of plants on the Earth's surface. NDVI is calculated by subtracting the infrared (IR) band from the visible red (R) band of the electromagnetic spectrum, and then normalizing the result by adding the sum of the two bands. This formula is written as:
NDVI = (IR - R) / (R + IR)
The NDVI values range from -1 to 1. Values close to -1 indicate a lack of vegetation, while values close to 1 indicate an abundance of vegetation. Areas with healthy vegetation will have higher NDVI values, while those with degraded vegetation will have lower NDVI values.
Indices derived from satellite imagery are used as the basis of many remote-sensing analyses. Indices have been used in thousands of applications, from detecting anthropogenic deforestation to examining crop health. For example, the growth of economically important crops such as wheat and cotton can be monitored throughout the growing season: Bare soil reflects more red wavelengths, whereas growing crops reflect more of near-infrared (NIR) wavelengths. Thus, calculating a ratio of these two bands can help monitor how well crops are growing (Jackson and Huete 1991).
Read more
Jackson, R. D., & Huete, A. R. (1991). Interpreting vegetation indices. Preventive veterinary medicine, 11(3-4), 185-200.