The Business Case for Orbit
Mastering the launch market economics using advanced spreadsheets.
The Narrative

You have just started as a Junior Analyst at Nova Capital. The firm is currently evaluating a massive investment in a satellite constellation startup called OrbitWeb.
OrbitWeb claims they can achieve profitability by launching 1,200 satellites at a "bulk rate" of $1,500/kg. Your Managing Director, Sara, is skeptical. She hands you a raw CSV of historical launch data and says:
"I need to know the ground truth. OrbitWeb's projections depend on market rates that haven't been seen yet. Pull the historical data, build a comparison model, and tell me: Is their $1,500/kg target realistic based on current market trends?"
Geographic Context

Launch costs aren't just about fuel; they are about geography. Rockets launching from the Equator (like Kourou, FR) gain a "slingshot" effect from Earth's rotation, reducing $/kg. Rockets launching from higher latitudes (like Vostochny, RU) require more energy to reach LEO.
Step 1: Choose Your Platform
Excel Setup: Structured Data
-
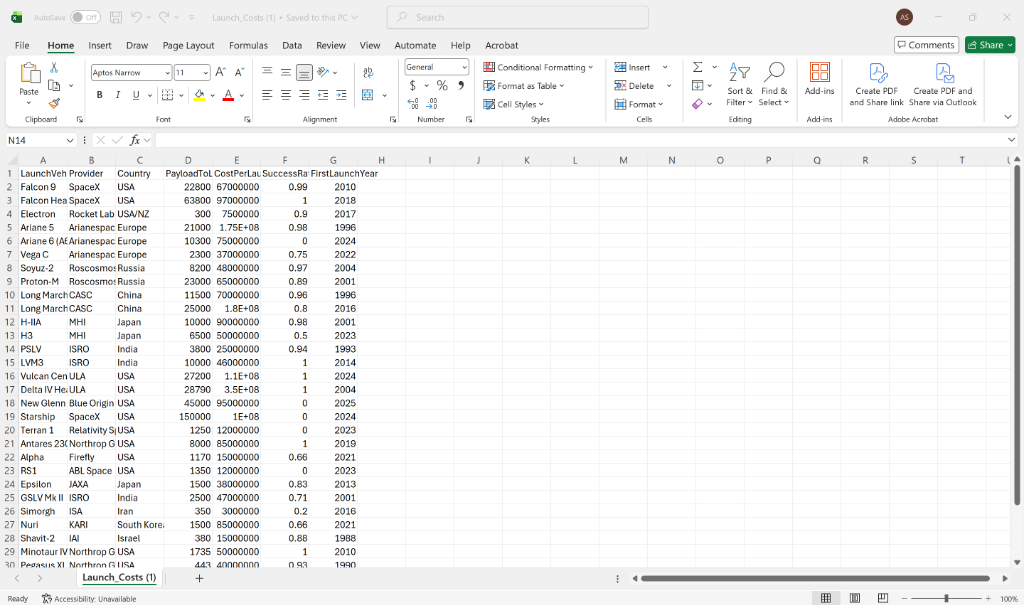
Download Launch_Costs.csv. Open Microsoft Excel from your computer, click File > Open, and select the downloaded file to view the raw data.
-
Table Conversion: Select any cell in your data and press
Ctrl + T. This converts the raw data into a structured Table Object.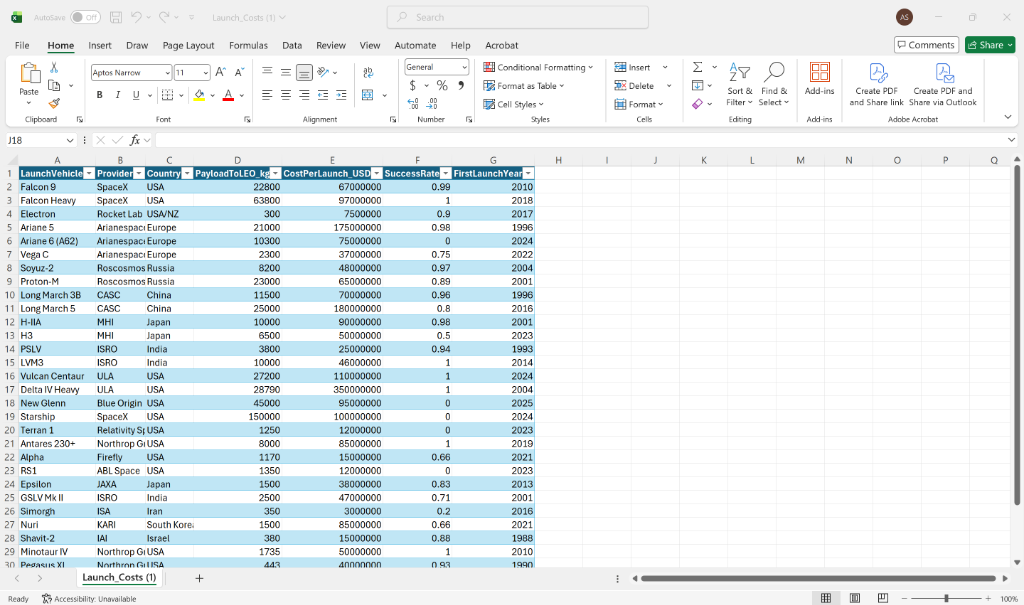
-
Naming: Right-click the worksheet tab at the bottom of the screen (typically named "Launch_Costs"), select "Rename", and change the tab name to
LaunchMarket.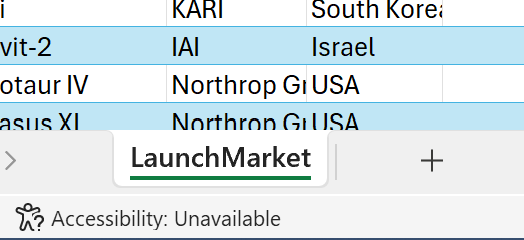
-
Data Hygiene: Navigate to the
Datatab and clickFilter(or click the arrows on the table headers). Use the dropdown menu to uncheck rows with 0 or missing values. In the space industry, a "0" usually means a flight hasn't happened yet (e.g., Starship v3).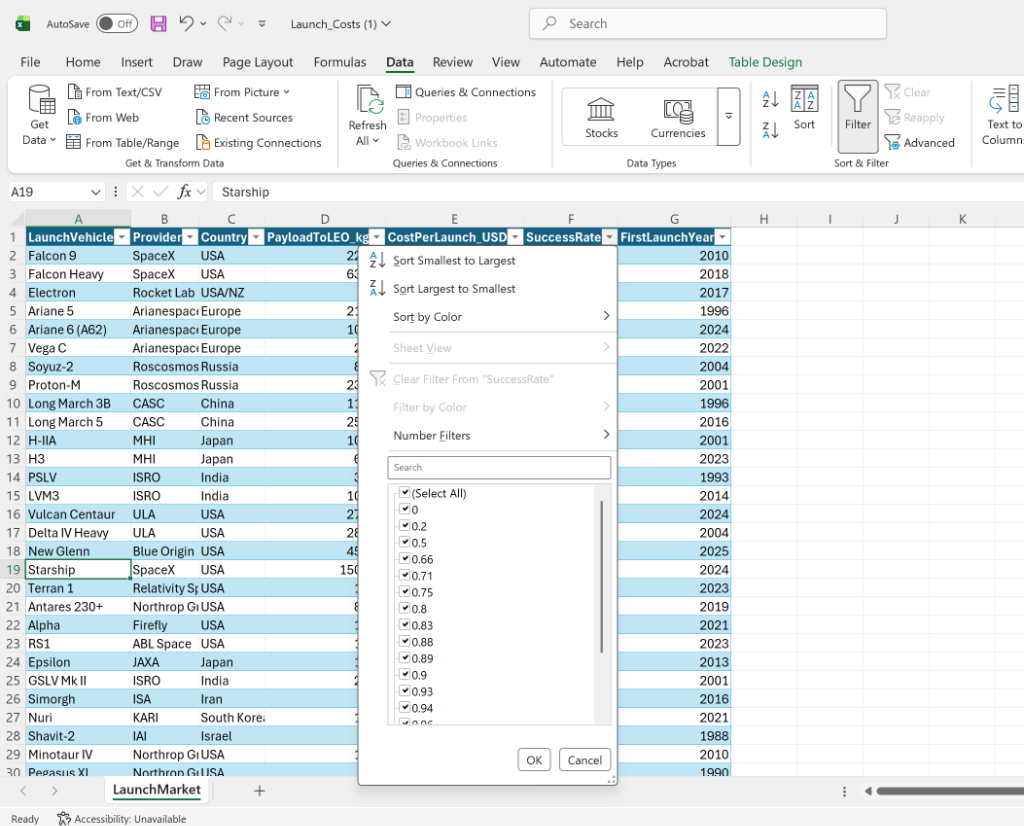
The Efficiency Formula ($/kg)
To calculate efficiency for beginners: In Excel, every formula begins with an equals sign (=). Instead of typing numbers, we click the cells to create dynamic "links". Because we are using Tables, Excel uses readable names like [@ColumnName].
- Click in the first empty cell of your new, empty column next to the data. Title the column header
Cost_Per_KG. - In the first empty cell of that column, type the equals sign:
= - With your mouse, click on the cell in the CostPerLaunch_USD column for that exact same row. You will see
=[@CostPerLaunch_USD]appear. - Type the forward slash
/(which means divide in Excel). - Click the cell in the PayloadToLEO_kg column for that row.
- Press the
Enterkey. Because it is a Table, Excel will automatically copy the formula down to every single row!
=[@CostPerLaunch_USD] / [@PayloadToLEO_kg]Google Sheets Setup: Collaborative Data
- Import the Data: Open Google Sheets, open a Blank Spreadsheet, then click
File > Import > Uploadto upload your Launch_Costs.csv file. - Named Ranges: Select your entire Cost column by clicking the letter at the top, then go to
Data > Named Rangesin the top menu. A sidebar will open; name this rangeLaunchCosts. This makes your formulas much more readable thanB2:B50. - Data Cleanup: Highlight all your data, then click
Data > Data Cleanup > Remove Duplicates. Space data often has repeats from different reporting agencies. - Conditional Formatting: Select your newly created "$/kg" column. Click
Format > Conditional Formatting. Set the rule to "Less than" and value to "2000", then change the fill color to a bright green. These highlighted rows are your "Disruptors."
Step 2: The Comparator Model
Sarah needs to compare any rocket to another side-by-side without digging through 100 rows of data. We will build a dynamic "VS" tool using Excel's most powerful lookup function.
XLOOKUP is built like a search engine. You give it what you want to find, where to look, and what answer to bring back.
- Lookup Value: The specific rocket name you type in (e.g.,
"Falcon 9"). - Lookup Array: The column containing all rocket names (
LaunchMarket[LaunchVehicle]). - Return Array: The column containing the data you want to retrieve (
LaunchMarket[Cost_Per_KG]).
=XLOOKUP(Target_Rocket, LaunchMarket[LaunchVehicle], LaunchMarket[Cost_Per_KG])
Step 3: The Investment Verdict
Based on your analysis, you must present a recommendation. Is OrbitWeb's $1,500/kg target achievable?
How to build the Executive Dashboard:
- Create a New Tab: Click the '+' at the bottom of Excel to make a new blank sheet. Name it "Dashboard".
- The Dropdown Menu: Click cell
B2on your Dashboard. Go to theDatatab in the ribbon and clickData Validation. Under 'Allow', select List. Click inside the 'Source' box, go to yourLaunchMarketdata tab, and highlight all the Launch Vehicle names. Click OK. Now cell B2 has a clickable dropdown! - The Output Logic: In cell
C2next to your dropdown, type your XLOOKUP formula to pull the specific Cost/kg based on whatever rocket is selected in B2. - The Chart: Go back to your data table. Highlight the "FirstLaunchYear" column, hold the
Ctrlkey, and highlight the "Cost_Per_KG" column. Go toInsert > Scatter > Scatter with Smooth Lines. Cut and paste this chart onto your Dashboard tab!
Artifact to Deliver
- Interactive Dashboard: A single sheet where changing a dropdown selection updates the "Efficiency" and "Success Rate" metrics automatically.
- Historical Trendline: A chart showing the drop in $/kg from 2000 to 2026.
- The Memo: A 100-word recommendation in a cell merged at the bottom: "Nova Capital should [Invest / Pass] because..."
Summary of Big Ideas
- Units Matter: Metric vs. Imperial is the #1 cause of satellite failure. Always verify your payload mass units.
- Structure > Cells: Tables and Named Ranges prevent "broken spreadsheet" syndrome once your dataset grows.
- Market Reality: Launch costs have dropped ~80% in the last decade, primarily driven by reusability.