Chapter 12

LiDAR & 3D Analysis

Seeing with light. Discover how LiDAR technology "digitally deforests" the planet to reveal hidden archaeology, flood risks, and forest structure.

At a Glance

Prereqs: Chapters 09-11 Time: 25 min read + 30 min practice Deliverable: DEM/DSM interpretation figure

Learning outcomes

  • Explain what LiDAR measures and what a point cloud represents.
  • Distinguish DEM, DSM, and derived height models.
  • Interpret a 3D product for a practical question (buildings/vegetation/terrain).

Key terms

LiDAR, point cloud, return, intensity, DEM, DSM, nDSM/CHM

Stop & check

  1. Why can LiDAR measure ground under trees better than optical imagery?

    Answer: Some pulses penetrate canopy gaps and return from the ground.

    Why: Multiple returns capture vertical structure.

    Common misconception: LiDAR is a photo; it is active ranging.

  2. What does DSM minus DEM represent?

    Answer: Height above ground (a normalized surface).

    Why: Subtracting terrain removes elevation baseline.

    Common misconception: DEM and DSM are interchangeable; they measure different surfaces.

Try it (5 minutes)

  1. Look at one hill and one building in the examples. Predict which surface (DEM/DSM) will show each.
  2. Write one sentence describing why.

Lab (Two Tracks)

Both tracks produce the same deliverable: a figure comparing DEM vs DSM plus a short interpretation paragraph.

Desktop GIS Track (ArcGIS Pro / QGIS)

Load a LiDAR-derived DEM and DSM, compute a normalized height surface, and annotate one feature.

Remote Sensing Track (Google Earth Engine)

Load an elevation/DSM-like product (or provided sample) and compute a simple difference surface; interpret.

Common mistakes

  • Using the wrong surface for a question (terrain vs objects).
  • Forgetting units/resolution and over-interpreting noise.
  • Confusing canopy height (CHM) with building height unless explicitly derived.

Further reading: https://www.ucgis.org/site/gis-t-body-of-knowledge

🦇 What is LiDAR?

LiDAR (Light Detection and Ranging) is an active remote sensing technology that uses laser pulses to measure distances. By firing thousands of laser pulses per second and measuring the time it takes for them to return, we can create a 3D Point Cloud of the Earth's surface.

The Superpower: Unlike traditional satellite imagery, LiDAR can "penetrate" vegetation. By filtering for the "last return," we can create a map of the bare ground beneath a dense forest canopy.

⚡ Pulse Interaction

Fire a laser pulse and watch for the returns (Echoes).

🌲
Waiting for pulse...

🏔️ DEM, DSM, and CHM

LiDAR allows us to generate different 3D surface models by filtering the point cloud:

  • DEM (Digital Elevation Model): The bare earth surface (ground only).
  • DSM (Digital Surface Model): The top-most surface (tree tops, roofs).
  • CHM (Canopy Height Model): The height of features (DSM - DEM).
Critical GIS: The Ethics of "Deforesting" Reality

LiDAR's ability to "digitally deforest" the Amazon or the Mayan jungle is a scientific triumph, but it can also be a weapon. By revealing ancient ruins or indigenous trails that were previously protected by the canopy, do we expose them to looting and unwanted contact? Just because we can map everything, does it mean we should?

🔬 GIS in Action: Case Studies

To illustrate the versatility of asking "Where," consider this example of a creative GIS application:

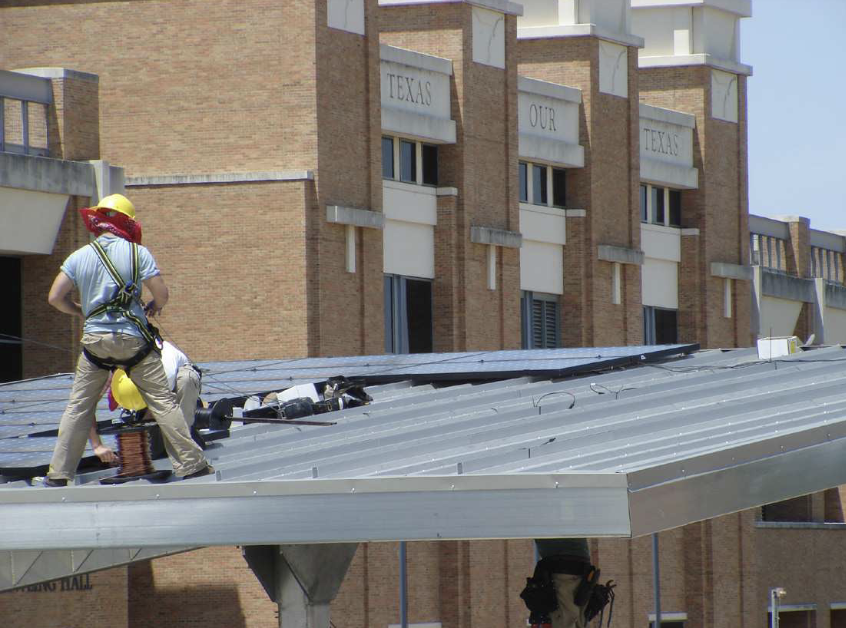
1. Sustainability: Are Solar Panels Enough?

The Question: Do trendy solar installations on rooftops actually make economic and environmental sense?

The Approach: Using LiDAR (Light Detection and Ranging), we created specific "Digital Roof Models" for both University of Texas and Southwestern University. By combining slope, aspect, and tree canopy shadows (NDVI), we calculated the exact solar potential of every single rooftop.

The Finding? Subsidies are crucial. Without them, the "payback period" for many installs exceeded 30 years, making them environmentally friendly but not economically sustainable.

University of Texas Solar Installation
The University of Texas at Austin's First Solar Photovoltaic installation on the main campus, installed as shading devices on the top of Manor Parking Garage. (Image Source: Fred C. Beach, Ph.D.)

Summary of Big Ideas

  • Point Clouds are the raw, unorganized results of a LiDAR scan.
  • Active Sensors (LiDAR) work day or night because they provide their own light.
  • Ground Filtering is the process of removing trees and buildings to reveal the terrain.
  • Z-Values provide the crucial third dimension (altitude) in GIS.

Chapter 12 Checkpoint

1. Which model would you use to measure the height of a specific building?

CHM (Canopy Height Model)
DEM (Digital Elevation Model)

2. How does LiDAR "see" the ground through a forest?

The laser passes directly through the leaves.
Some pulses pass through small gaps between the leaves.

📚 Chapter Glossary

Point Cloud A set of data points in a 3D coordinate system (X, Y, Z), typically defined by X, Y, and Z coordinates, and often intended to represent the external surface of an object.
Return (Echo) The reflection of the laser pulse back to the sensor. A single pulse can have multiple returns (e.g., hitting a leaf, then a branch, then the ground).
Intensity The strength of the return signal, which can be used to distinguish between different surface materials (e.g., asphalt vs. grass).
← Chapter 11: Image Classification Next: Chapter 13: Spatial Analysis (Intro) →

BoK Alignment

Topics in the UCGIS GIS&T Body of Knowledge that support this chapter.