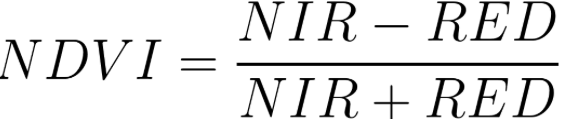
NDVI is a fast, interpretable measure of vegetation vigor. It contrasts near-infrared (high reflectance for healthy leaves) with red (chlorophyll absorption) to produce values from -1 to 1.
Learning objectives
- Explain what NDVI measures and typical value ranges.
- Compute NDVI on Landsat or Sentinel-2 data in Earth Engine.
- Mask and visualize NDVI meaningfully.
- Interpret common NDVI pitfalls (clouds, scale/offset, phenology).
Quick win: NDVI on Landsat 8
// Landsat 8 SR: apply scale/offset
var img = ee.Image('LANDSAT/LC08/C02/T1_L2/LC08_044034_20210623')
  .multiply(0.0000275).add(-0.2);
var ndvi = img.normalizedDifference(['SR_B5', 'SR_B4']).rename('NDVI');

Map.centerObject(img, 9);
Map.addLayer(ndvi, {min: 0, max: 0.8, palette: ['brown', 'yellow', 'green']}, 'NDVI');

// Inspect values
print('NDVI stats', ndvi.reduceRegion({
  reducer: ee.Reducer.minMax(),
  geometry: img.geometry(),
  scale: 30,
  maxPixels: 1e9
}));
What we should see
A green-to-brown NDVI layer; console min/max near 0-0.8 in vegetated areas.
Value guide
- -1 to 0: water, clouds, shadows.
- 0 to 0.2: bare soil or sparse vegetation.
- 0.2 to 0.5: moderate vegetation.
- 0.5 to 0.9: dense, healthy vegetation.
Pro tips
- Always mask clouds/shadows before computing NDVI.
- Use native bands: Landsat 8 (B5 NIR, B4 red); Sentinel-2 (B8 NIR, B4 red).
- Keep visualization ranges modest (for example, min 0, max 0.8) to avoid washed-out maps.
Try it: extend the workflow
Swap to Sentinel-2 SR and recompute NDVI (B8, B4).
Threshold NDVI at 0.3 to mask vegetation: ndvi.gte(0.3).
Plot a time series of mean NDVI over an AOI using ui.Chart.image.series.
Common mistakes
- Forgetting scale/offset on surface reflectance products.
- Interpreting cloudy pixels as low NDVI; mask first.
- Comparing NDVI across sensors without consistent preprocessing.
🌍 Real-World Application
Agricultural Monitoring: The USDA uses NDVI from satellites to monitor crop health across millions of acres. Farmers can detect drought stress, pest damage, or nutrient deficiencies weeks before visible symptoms appear—saving crops and reducing costs.
Deforestation Tracking: Brazil's PRODES program uses NDVI time series to detect illegal deforestation in the Amazon, triggering enforcement actions within days of clearing.
Quick self-check
- Why does NDVI use NIR and red?
- What NDVI range suggests healthy vegetation?
- What should you do before computing NDVI on a cloudy scene?
This module builds on
- Band Arithmetic - understanding band operations
- Image Collections - loading and filtering imagery
Next steps
- Spectral Indices - explore NDWI, EVI, and more
- Cloud Masking - clean our data before calculating NDVI
- Temporal Compositing - create monthly NDVI composites
- Classification - use NDVI as a classification feature
Going Deeper: EEFA Book
This module gives us the foundation. To explore further, see Chapter F3.1 (Spectral Indices) in the Cloud-Based Remote Sensing with Google Earth Engine (EEFA Book).