Exploring the StoryMap Builder
Get familiar with the StoryMap interface and learn how to use its building blocks to communicate geographic knowledge and spatial stories.
🎯 Learning Objectives
- Master the StoryMap builder interface and how it supports geographic communication
- Understand the block-based content system and when to use each type
- Learn how to layer text, images, and maps to tell geographic stories
- Discover immersive storytelling features that reveal spatial relationships
- Explore how to integrate geographic data and share spatial knowledge
The StoryMap Builder Interface
When you create a new story (by clicking "Create" from your Stories Dashboard), you'll enter the StoryMap Builder.
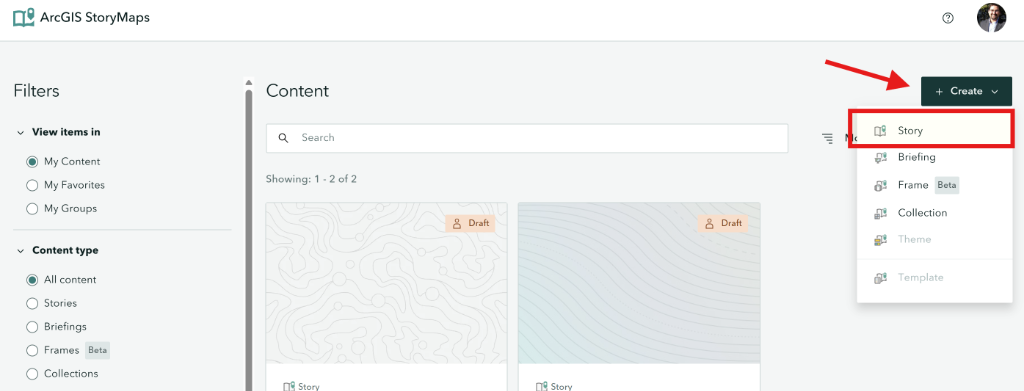
This is your creative workspace where all the magic happens.
Understanding Content Blocks
The "Plus" Button
You build your story one piece at a time. To add any content, hover over your story canvas and click the Green Plus (+) Button whenever it appears. This opens the Block Palette containing all your tools.
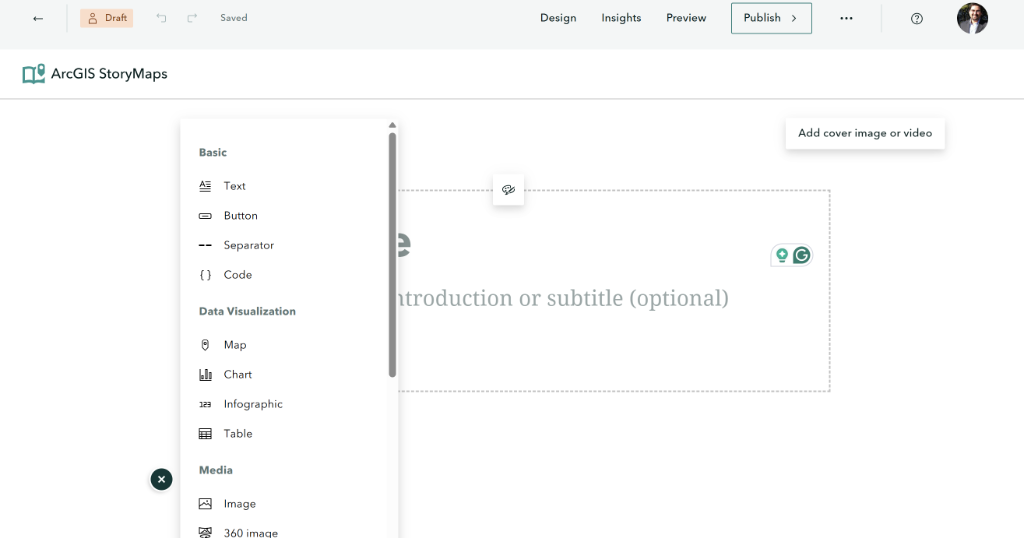
Block Types
StoryMaps uses a block-based system. Think of each block as a building brick - you stack them to create your complete geographic narrative. Here are the main block types and how geographers use them:
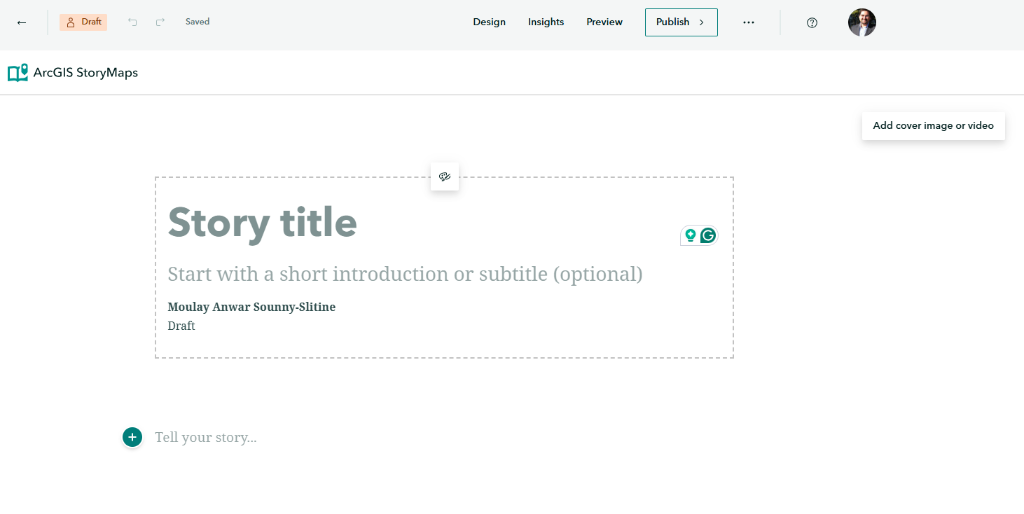
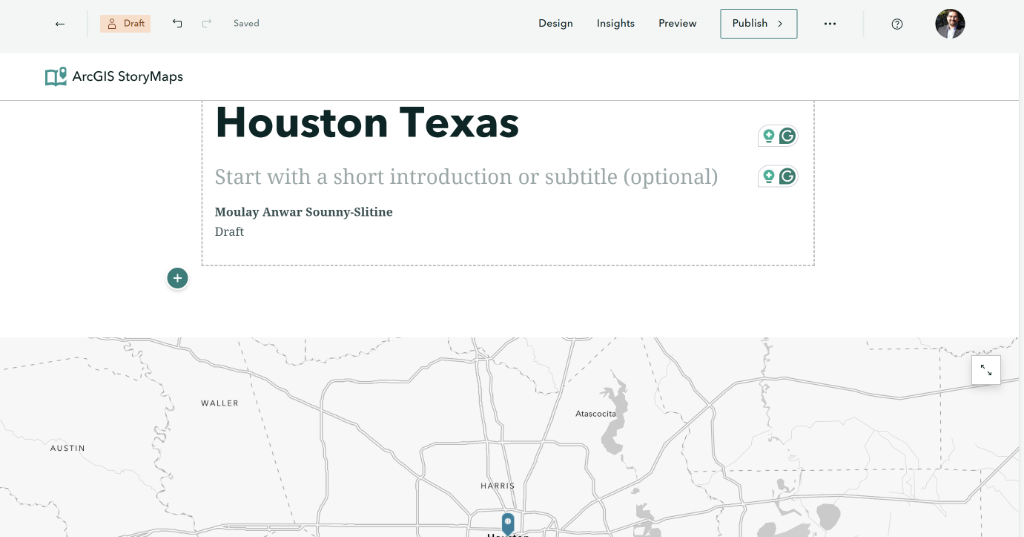
🎬 Cover Block - Your Geographic Entry Point
Your cover is the reader's first impression of your geographic story. Use a striking image of your place or phenomenon. Add a title that frames your geographic focus and a subtitle that hints at what readers will discover.
📝 Text Block - Geographic Narrative
Add your geographic analysis, place descriptions, and spatial explanations. Use rich formatting to guide readers through your geographic argument. Start chapters with H1 to create navigable sections.
• H1 = New Geographic Theme (appears as chapter)
• H2 = Sub-theme or location detail
• Paragraphs = Analysis, evidence, and context
• Quotes = Primary sources or expert insights
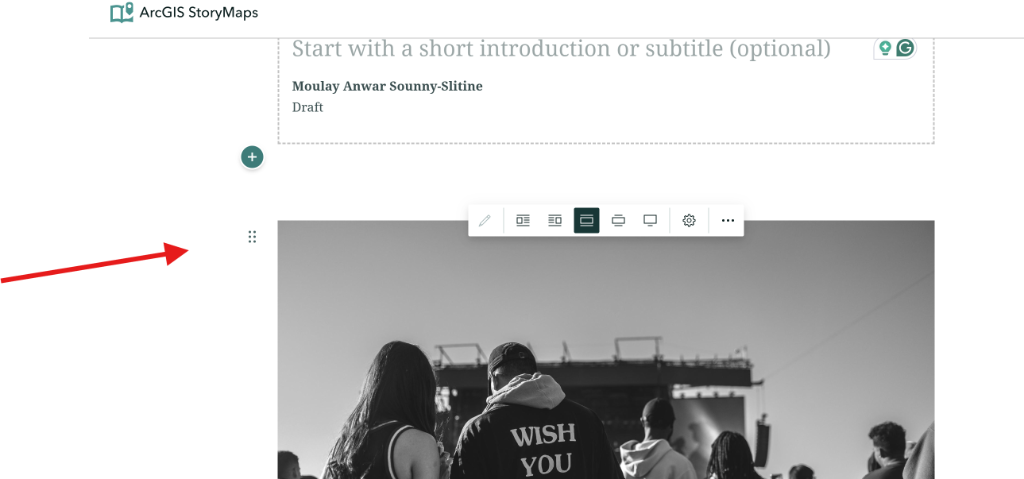
🖼️ Media Block - Visual Geographic Evidence
Embed photographs, field documentation, maps, videos, and audio. Use media to show geographic features, landscape changes, and spatial relationships that words alone cannot convey.
• Photographs: Landscape features, place characteristics, cultural elements
• Video: Field documentation, time-lapse changes, expert commentary
• Audio: Interviews, ambient sounds, geographic narration
• Comparisons: Before/after images showing geographic change
📸 Need High-Quality Images?
Don't use blurry, low-res images! Use Unsplash.com to find professional, royalty-free photography.
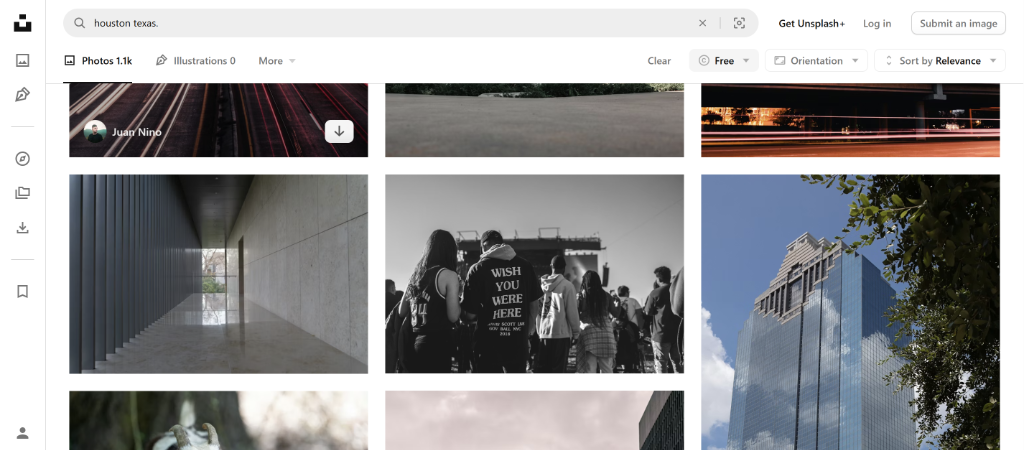
Tip: Always select the "Free" filter to ensure you have permission to use the photos.
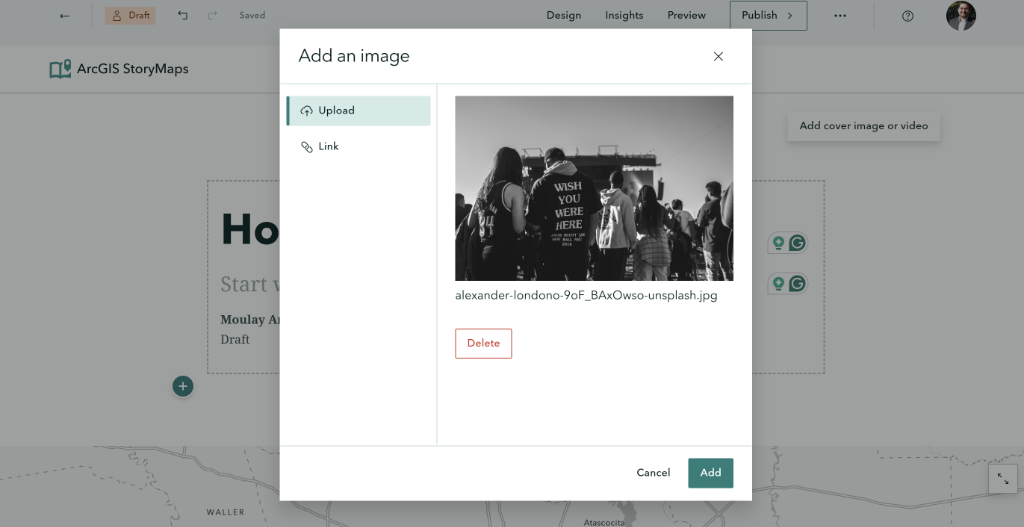
How to Add It: Once you've downloaded your image, select "Image" from the block palette and use the Upload tab to bring it into your story.
🗺️ Map Block - Your Geographic Centerpiece
When you add a map, you'll see the Map Browser. This powerful window connects you to your entire ArcGIS ecosystem.
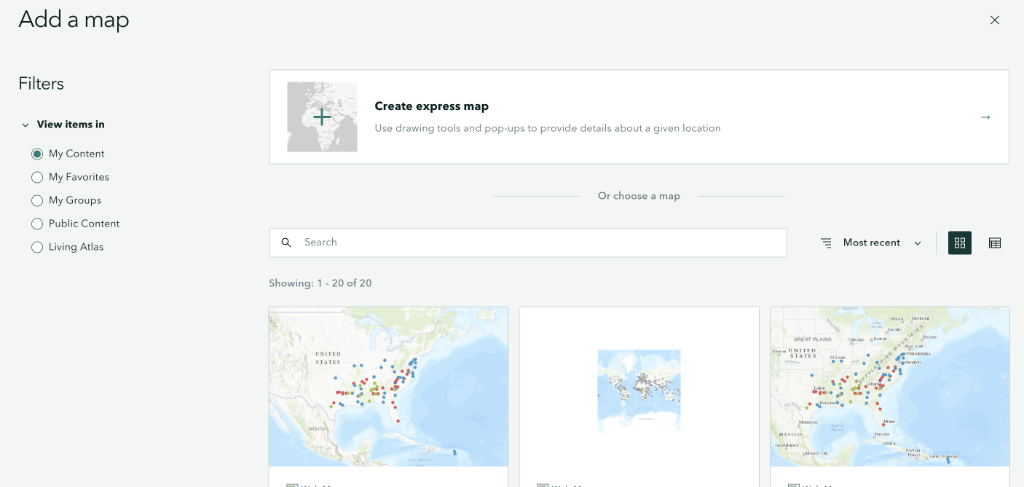
Why this is powerful: Any data, web maps, or layers you already have in ArcGIS Online under "My Content" are instantly available here. You don't need to rebuild maps; just select them to bring your existing geographic analysis directly into your story.
No Map Yet? Use Express Maps!
If you don't have a pre-made map, simply click "Create express map". This tool lets you build a clear, simple reference map on the fly directly within the builder.
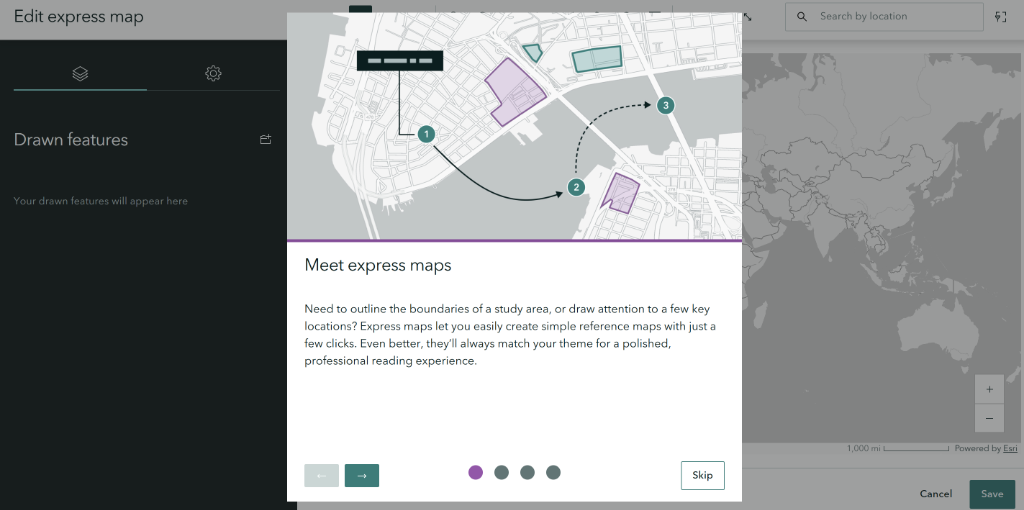
Express maps are perfect for:
- 📍 Sketching study areas
- 🏹 Drawing routes and arrows
- 🏷️ Labeling key locations quickly
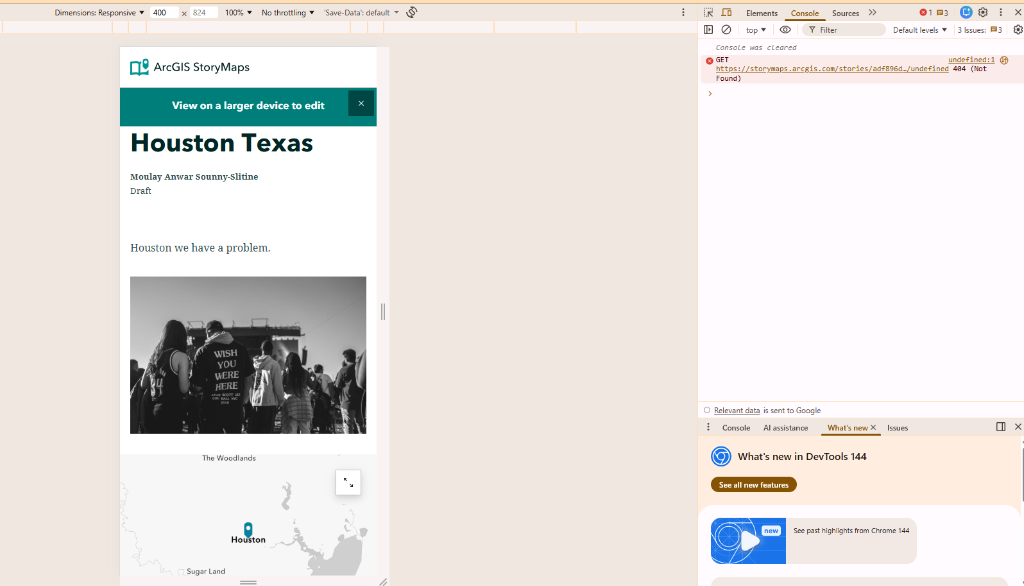
You don't have to find places manually! Use the Search Bar (your built-in geocoding agent) to type any city, address, or landmark - like "Houston, Texas".
Click "Add to map" on the result to instantly drop a marker at that exact location.
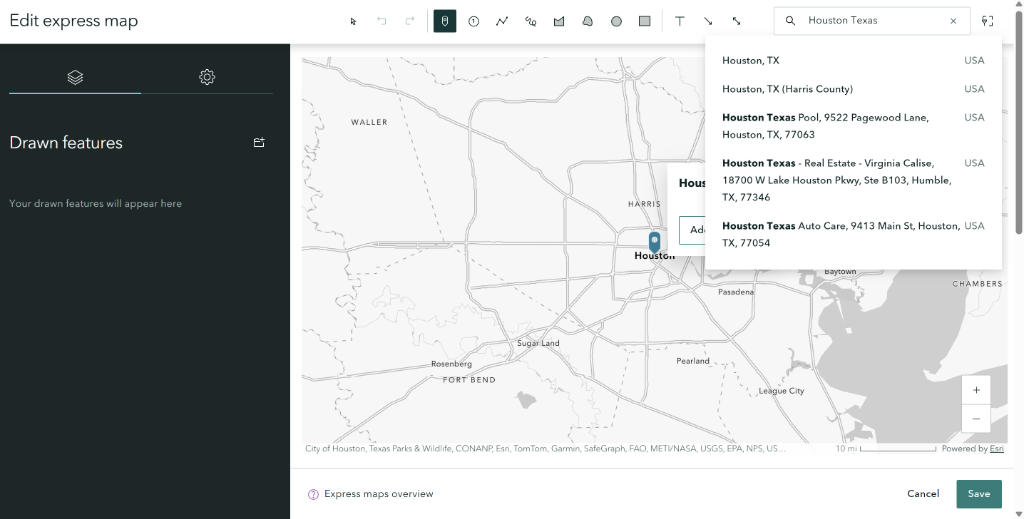
The Result: Once you click "Place map", your custom interactive map is instantly embedded into your narrative block.
• Express Maps: Quick locations, simple annotations, labeled features
• Web Maps: Multiple data layers, analysis results, demographic data
• Sizing: Small (inline), Medium (half-width), Large (full-width)
🔗 Button Block
Add call-to-action buttons that link to external resources, other stories, or specific sections within your story.
➖ Separator Block
Visual dividers to break up content sections. Choose from different styles: line, dots, or spacing.
Immersive Geographic Storytelling Blocks
These powerful blocks create scroll-driven, interactive experiences that are ideal for revealing geographic relationships, spatial changes, and complex place-based narratives:
📐 Sidecar - Guided Geographic Tours
Create a split-screen experience with scrolling narrative panels on one side and a map/image/video on the other. Perfect for showing how geography unfolds across a location.
- Perfect for: Spatial field tours and place-based narratives
- Perfect for: Geographic change documentation
- Perfect for: Multi-step geographic analysis
- Pro Feature: Use Map Actions to auto-pan/zoom as readers scroll
• Use "Docked" version for a panel that stays fixed while readers scroll through slides
• Add Map Actions to automatically zoom/pan to specific locations as users navigate slides!
🎠 Slideshow
Full-screen slides that readers navigate through. Each slide can have different backgrounds with overlaid text and media.
- Best for: Photo essays
- Best for: Key statistics
- Best for: Location highlights
🧭 Map Tour
Showcase a series of locations on a map. Readers explore numbered points, each with its own photo, title, and description.
- Best for: Travel itineraries
- Best for: Field research sites
- Best for: Historic locations
• From Feature Service: Import existing point data from ArcGIS Online
• Start from Scratch: Manually add tour points one by one (click map to place each point)
Express Maps: Quick Map Creation
Express Maps is StoryMaps' built-in mapping tool for creating simple, focused maps without leaving the builder. Perfect for locator maps and visual annotations!
Points
Add location markers. Choose numbered points (1, 2, 3...) for sequential stops or regular pins for general locations.
Lines
Draw routes, paths, or boundaries. Use straight lines or freehand drawing for irregular shapes.
Areas
Highlight regions with filled polygons. Great for showing neighborhoods, zones, or territories.
Arrows
Show direction, movement, or flow. Perfect for indicating routes or highlighting specific areas.
Text Labels
Add annotations directly on the map to label features, areas, or provide context.
Styling
Customize colors, line width, opacity, and fill patterns for all drawing elements to match your story's theme.
Map Actions: Interactive Navigation
Map Actions let you create dynamic, interactive map experiences within Sidecars. As readers scroll through your narrative, the map automatically zooms and pans to specific locations!
🎯 How It Works
- Create a Sidecar with a map as the media
- Add slides to your Sidecar
- For each slide, click "Add map action"
- Set the zoom level and location for that slide
- When readers reach that slide, the map automatically navigates!
✨ Use Cases
- Zoom from country overview to city detail
- Highlight different neighborhoods as story progresses
- Focus on specific features in your data
- Create a visual "flythrough" of locations
Customizing Your Story's Look
To open the Design panel, click the Design button in the top header menu. This panel will slide out from the right side of your screen.
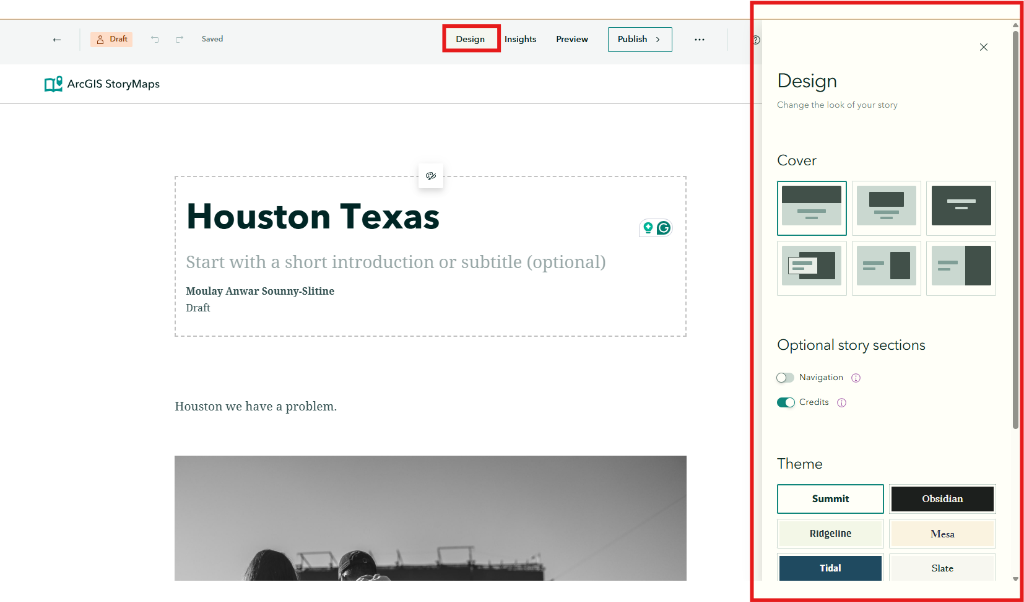
Use this panel to customize your story's visual appearance:
Theme
Choose from pre-built themes or create custom color combinations for your story's overall look.
Typography
Select font pairings for headings and body text. Several professional combinations are available.
Cover Layout
Customize how your cover displays: full-screen, side-by-side, or minimal styles.
Navigation
Add a table of contents for longer stories to help readers navigate sections.
Preview & Publish
Before sharing your story with the world, always preview and test:
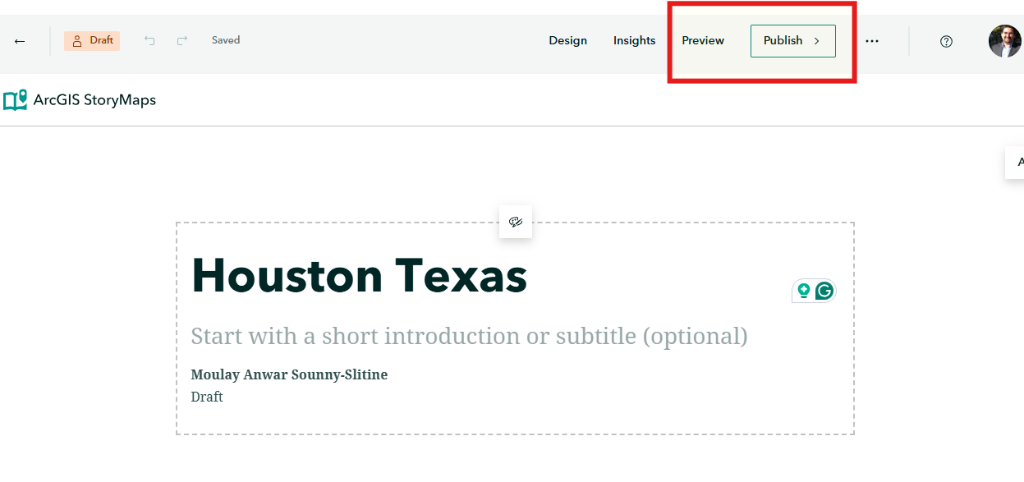
Preview
Click "Preview" in the builder header. This provides the most accurate view of what your readers will see.
Test Devices
Use the floating toolbar to switch between Desktop, Tablet, and Phone views. Click Rotate to test landscape orientation!
Publish
Set sharing (Private, Organization, or Public). Remember: Always preview before you publish!
Sharing Options Explained:
Only you can view the story
Anyone in your org can view
Anyone with the link can view
Your embedded maps and media must have the same or greater sharing level as your story. If your story is Public but your embedded map is Private, viewers won't be able to see the map!
Beyond the Story: The ArcGIS StoryMaps Ecosystem
While vertically-scrolling "Stories" are the most common output, the ArcGIS StoryMaps platform offers several other powerful ways to package and present geographic information:
Collections
Group multiple stories, briefings, and maps into a single, cohesive portfolio. Perfect for final projects or thematic series.
Briefings
Slide-based, presentation-style content. Ideal for briefings, executive summaries, and meetings where you need to present geographic findings.
Frames
Mobile-first, short-form storytelling using vertical slides. Similar to social media "stories," optimized for quick consumption on phones.
Themes
The "Theme Builder" lets you create custom visual styles—colors, fonts, and logos—to apply across all your StoryMap content.