The Fundamental Geodetic Challenge
The Earth is not a perfect sphere; it's an oblate spheroid (bulging at the equator) with a bumpy, geoid surface. To map it, we must first model it using a Datum.
Latitude, Longitude & The Graticule
To measure location on a varied sphere, we need a grid.
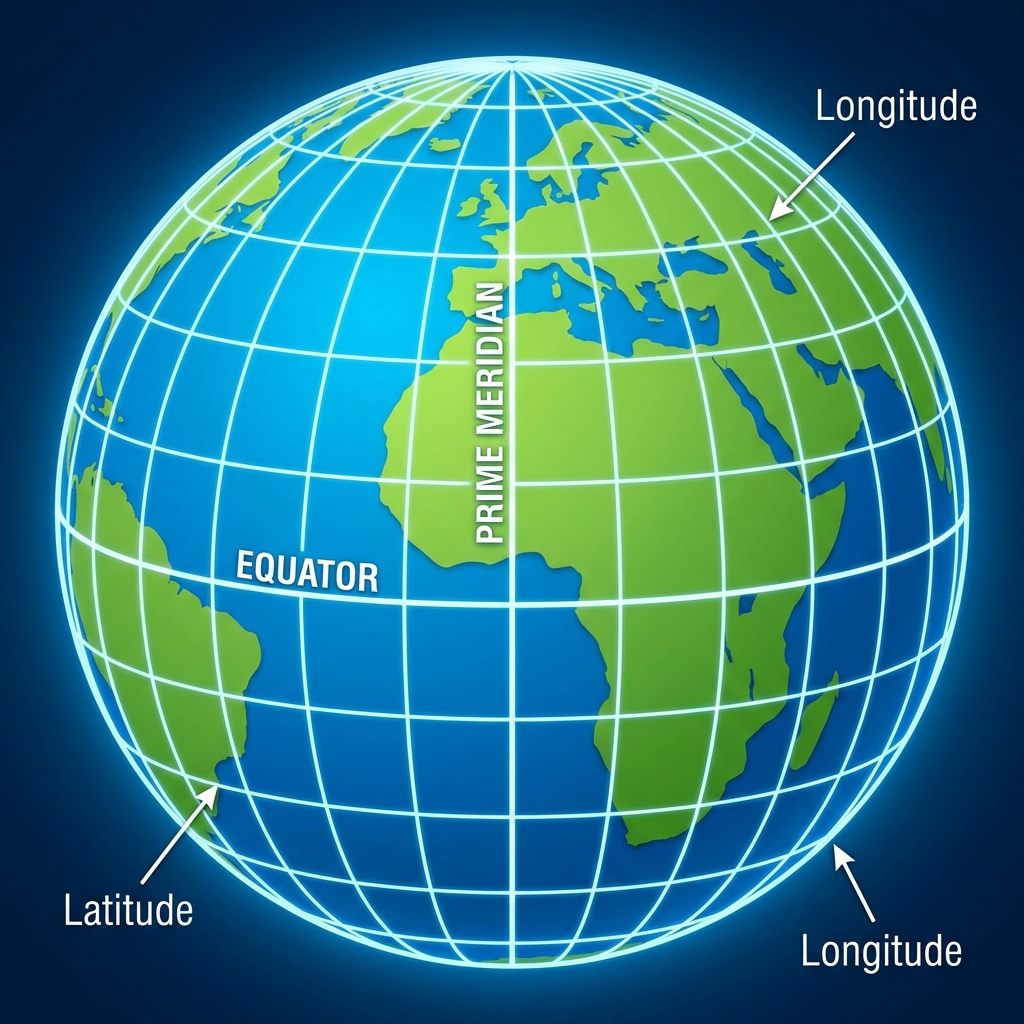
- Latitude (Parallels): Measure North-South (0° at Equator to 90° at Poles). Lines never touch.
- Longitude (Meridians): Measure East-West (0° at Prime Meridian to 180°). Lines converge at poles.
Projection Explorer
Toggle between different mathematical projections to see how the shapes and sizes of continents change. Watch Greenland closely, as it is the classic victim of map distortion!
For centuries, the Mercator projection was the standard for schools. Accused of "Colonialist Bias," it exaggerates the size of Europe and North America while shrinking Africa and South America. (Toggle between Mercator and Gall-Peters or Equal Area above to see the massive difference! Africa is actually 14 times larger than Greenland.)
🌎 PRJ: Map Projection Database
Explore more than 80 different map projections using Dr. Sounny's interactive PRJ CRS Clearinghouse. This powerful tool provides detailed metadata, EPSG codes, and visualizations of distortion patterns for both common and rare coordinate systems used in professional GIS workflows.
Projection Surfaces
How do we flatten the globe? Imagine wrapping a piece of paper around a lightbulb (the translucent Earth). Where the paper touches the globe, distortion is minimal. As you move away from the point of contact, distortion increases.
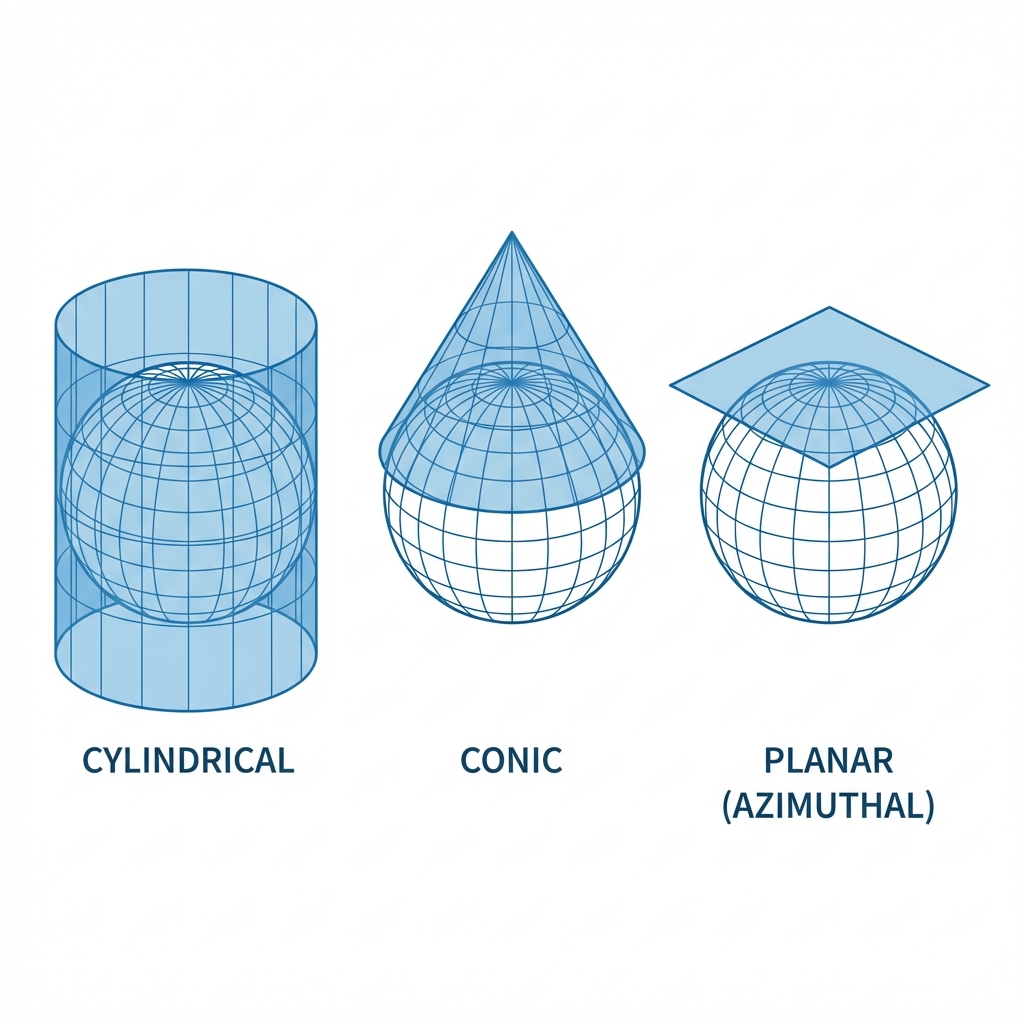
- Cylindrical: Paper wrapped as a tube (Good for Equator, e.g., Mercator).
- Conic: Paper formed as a cone (Good for Mid-Latitudes, e.g., US & Europe).
- Planar (Azimuthal): Paper touching one point (Good for Poles).
🔦 The Lightbulb Analogy: Cylindrical Projection
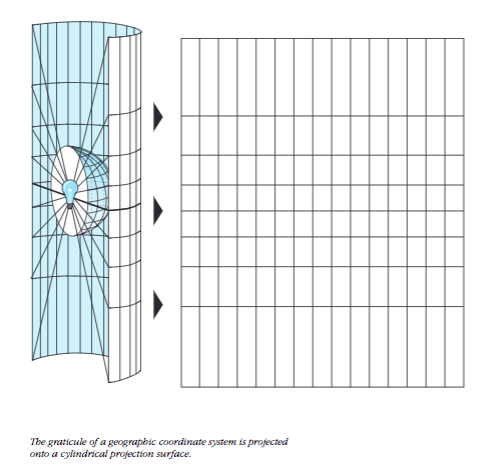
A lightbulb inside a transparent globe projects features onto a surrounding cylinder
How it works:
- Imagine a transparent globe with continents drawn on it.
- Place a lightbulb at the center of the globe.
- Wrap a cylinder of paper around the globe, touching at the Equator.
- The light projects the shadows of the continents onto the cylinder.
- Unroll the cylinder—you have a flat map!
Notice how features near the Equator (where the cylinder touches) are projected accurately. But features near the poles are stretched dramatically—the light rays hit the cylinder at increasingly steep angles, causing massive distortion. This is why Greenland looks enormous on a Mercator map!
The "Big Four" Distortions
When you flatten the Earth, you must sacrifice one or more of these properties. A projection can be:
- Conformal: Preserves Shapes (essential for local surveying).
- Equivalent: Preserves Area (essential for thematic maps of population).
- Equidistant: Preserves Distance (measured from one or two points).
- Azimuthal: Preserves Direction (important for flight paths).
Map Preprocessing
Projections are just the beginning. To make different datasets play nicely together, we often need to perform "housecleaning" tasks:
1. Georeferencing
Aligning a raw image (like a scanned map or aerial photo) to a known coordinate system. This is done by creating control points that link the pixels of the image to real-world coordinates.
.tfw or .jpw) containing the math to position the image.
2. Resampling
When you change a raster's projection or cell size, the grid must be recalculated. Common methods include:
- Nearest Neighbor: Fast, keeps original values (good for discrete data like Land Use).
- Bilinear Interpolation: Smoothes values (good for continuous data like Elevation).
3. Edge Matching
Stitching together adjacent maps (like tiles) to ensure features like roads connect seamlessly across boundaries.
State Plane Coordinate System (SPCS)
While UTM is global, the State Plane Coordinate System is purely American. It divides the U.S. into over 120 zones to minimize distortion for local surveying and engineering.
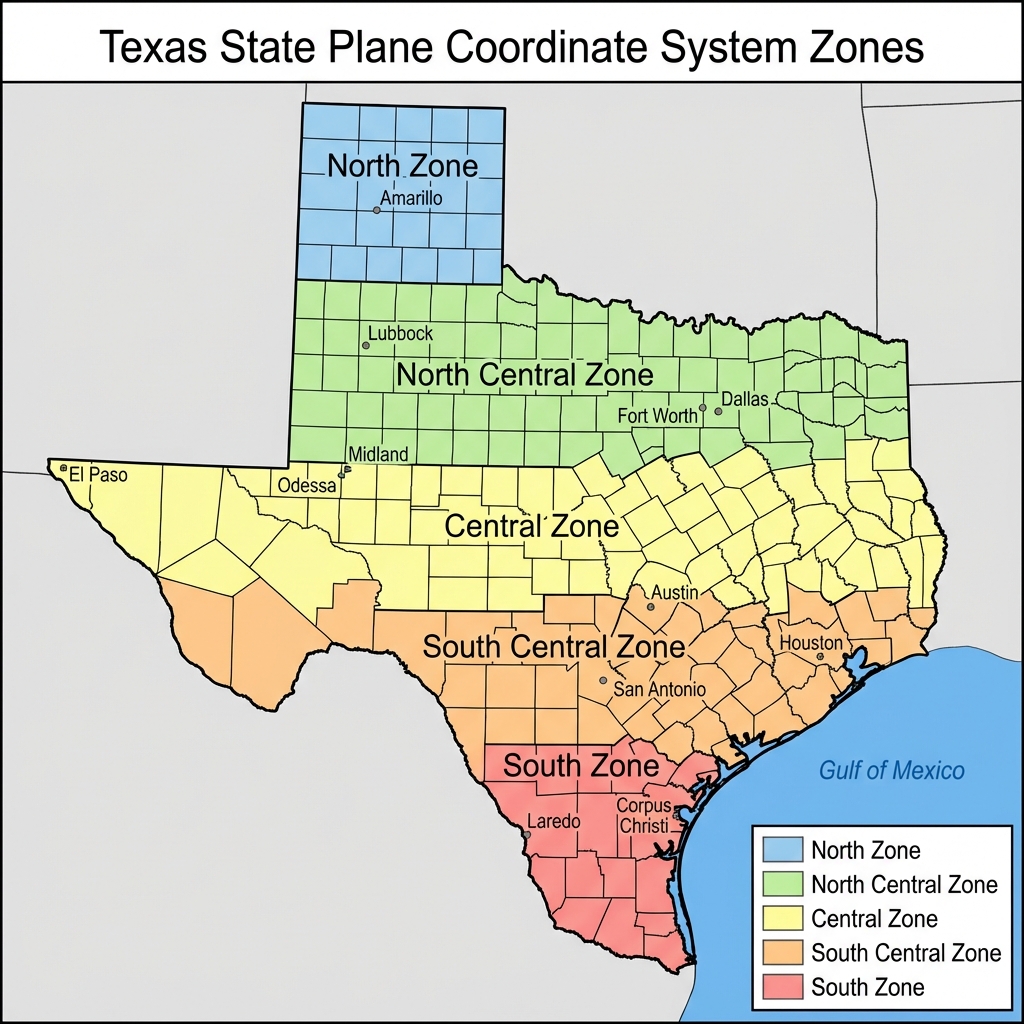
Figure 3.6: The SPCS divides states like California into multiple horizontal belts (Zones) to maintain high precision.
- The Goal: To allow surveyors to treat the earth as "flat" within a small zone with error rates of less than 1 part in 10,000.
- The Zones:
- North-South States: (like California) are often divided into horizontal strips using the Lambert Conformal Conic projection.
- East-West States: (like Illinois) often use vertical strips based on the Transverse Mercator projection.
- The Catch: It is a nightmare when your project crosses zone boundaries (e.g., a roadmap from San Francisco to Los Angeles crosses multiple zones).
Summary of Big Ideas
- Geodesy is the science of measuring Earth's shape.
- A Datum (like WGS84) is a mathematical reference for coordinates.
- Coordinate Systems can be Geographic (lat/long) or Projected (meters/feet).
- The Mercator projection is perfect for sailing but terrible for comparing country sizes.
- Practice Tool: Use the PRJ CRS Clearinghouse to explore the specific distortion patterns and metadata of over 80 different map projections.
Chapter 03 Checkpoint
1. Which projection is the "standard" used by most web maps (Google Maps, Leaflet)?
2. If you are making a map of "Total Forest Cover" where comparing sizes is crucial, which type of projection should you use?